I’m aware that I may be eating my words in the not so distant future but alas: I just took a gander at my market momentum charts and none of them are even close to bearish territory, quite on the contrary. In fact what I’m seeing at the current time is simply the natural process of correcting a market that got a wee bit ahead of itself in late August.
I usually reserve these charts for my intrepid subs but since they are not flagging any immediate action I believe it’s fair to post them in the open. Mind you, these are some of the most accurate LT gauges I have put together over the years and they have treated me (and my paying supporters) very well.
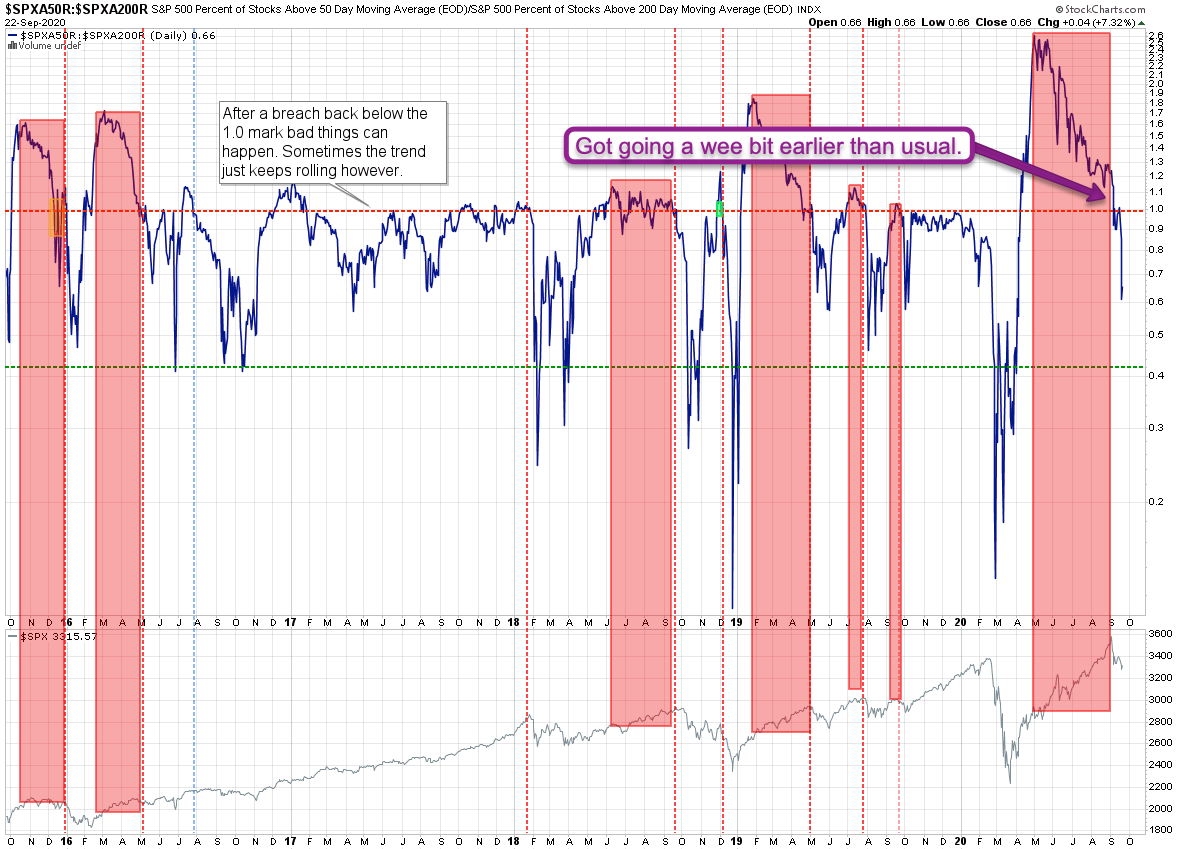
First runner up is market breadth which flagged an impending medium term correction in late August. In comparison with previous signals things got going a wee bit earlier than usual.
The first big take away here is that the magnitude of the correction cannot be predicted. It may be deep or or it may be shallow. The second is that breadth is now in neutral territory and it’s pretty rare that we immediately bounce from here. Usually we correct at least to the 0.4 mark.
So what this indicates to me is that we are most likely not out of the woods just yet. Especially with November coming.
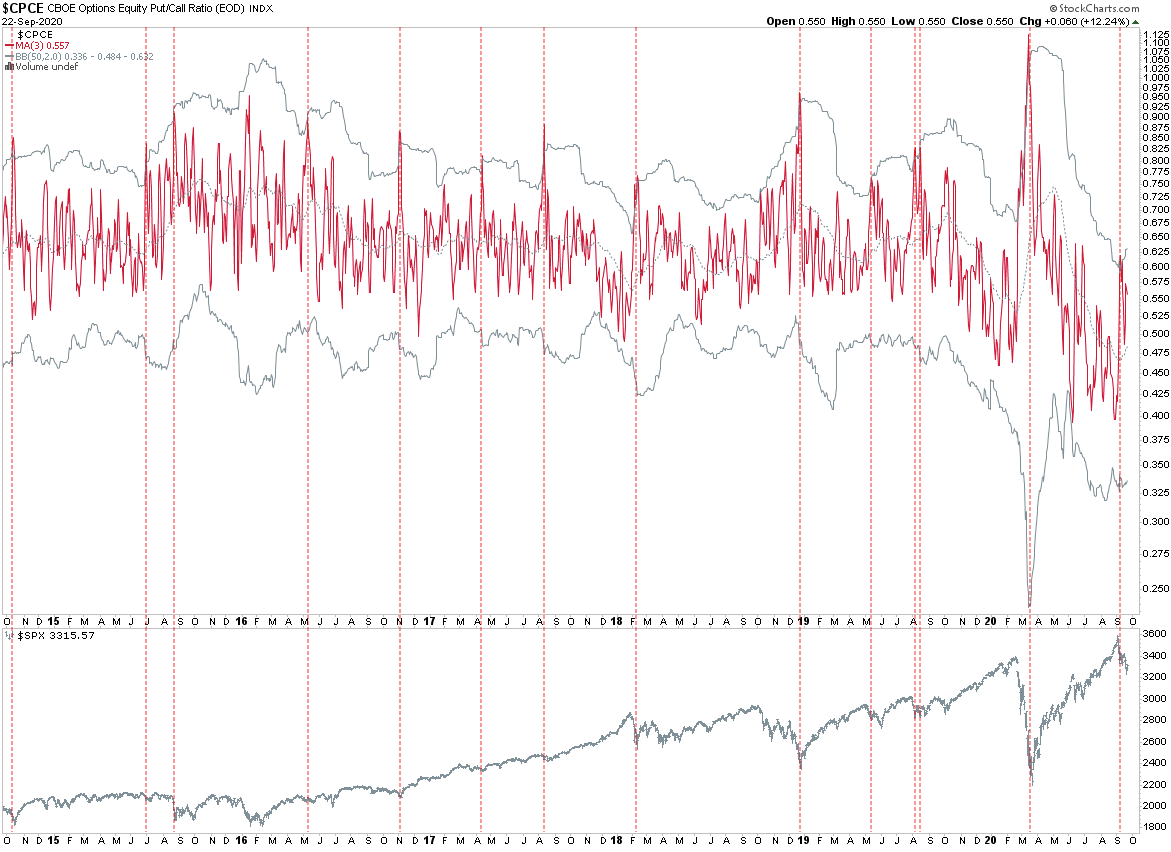
The CPCE chart above usually does a bang job signaling a possible floor post correction. The only problem this time around is that it flagged at the height of the market as if a correction had already taken place. I have not observed P/C behavior like that in the past except during sideways markets.
This may be good news for the bulls in that it suggests that the market sentiment is resembling that we would see after a correction. Which we have been getting of course but after the signal triggered – go figure.
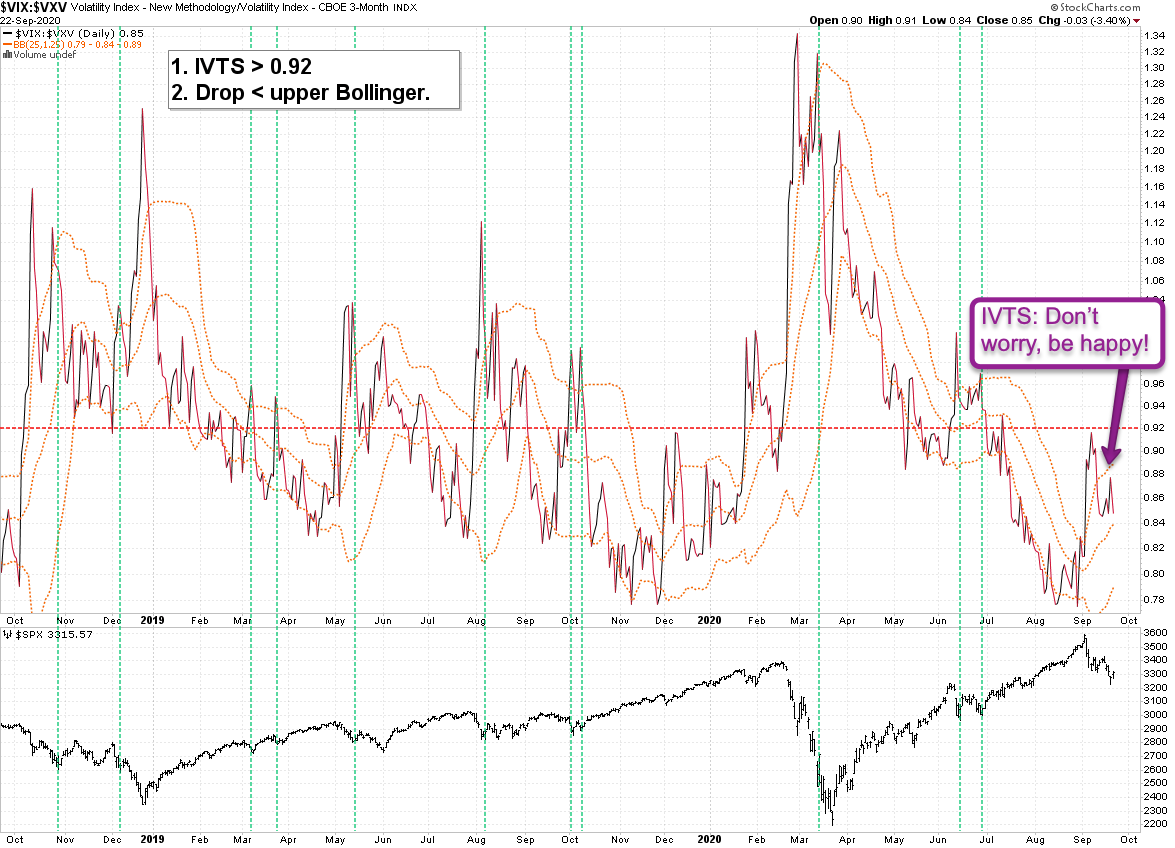
Let’s talk implied volatility. The IV term structure (IVTS) also has done a great job when it comes to flagging market floors. Unfortunately – or perhaps fortunately – the signal has stubbornly remained below the 0.92 mark. Which – per our rather exhaustive statistics is the threshold after which bullish trend and MR systems start to break down.
It’s really strange that the current wipe out has not been able to shift the IVTS at all. If you look back to February of 2020 then you see that a rather tiny correction (ahead of the big one) popped the IVTS all the way into 1.0 – which is deep in bearish territory.
Alright, I hope you are sufficiently warmed up as we’re now going to make sense of it all:
Please log in to your RPQ membership in order to view the rest of this post. Not a member yet? Click here to learn more about how Red Pill Quants can help you advance your trading to the next level.