I have never made two bones about the fact that picking market tops or bottoms is a hare-brained exercise in futility. It’s for retail jackasses who enjoy racing downhill in oversized shopping carts. That said, in my never ending quest for market domination I may have come across something that may actually have some use for you chronic BTFD addicts.
However before we get to the juicy stuff let’s do a quick and dirty refresher on Z-Score. If you’ve never heard of Z-Scores then the first thing you probably want to know is why you should care in the first place.
To answer to that is very simple: Z-Scores put things into historical context. And it they do that very well by measuring how far a value is from its mean in standard deviations.
Geeky? Yes, because it is. But damn bloody useful.
Let’s say for example someone tells you that 41 inches of rain in Seattle last year was way above the average and absolutely unheard of.
My response:

Let’s look at the numbers:
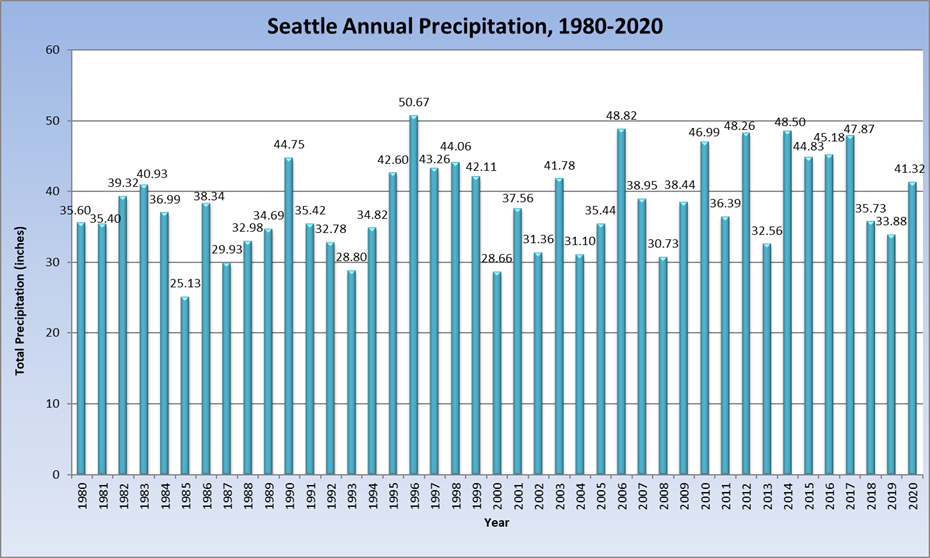
Very nice. Shitty Seattle weather galore. From here all we need to do is a bit of simple arithmetic, which you can find here.
The formula in the spreadsheet is rather trivial and boils down to this:
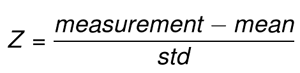
Yes, you guessed right, that’s the formula for calculating a Z-Score. And what becomes immediately clear after running the numbers is that 41 inches of rainfall in Seattle is nothing extraordinary as it’s Z-Score is at 0.37.
Meaning it’s around the 0.37 mark if you put it into the context of one standard deviation.
Ahaaaah! Did the penny just drop? Very useful indeed, ain’t it?
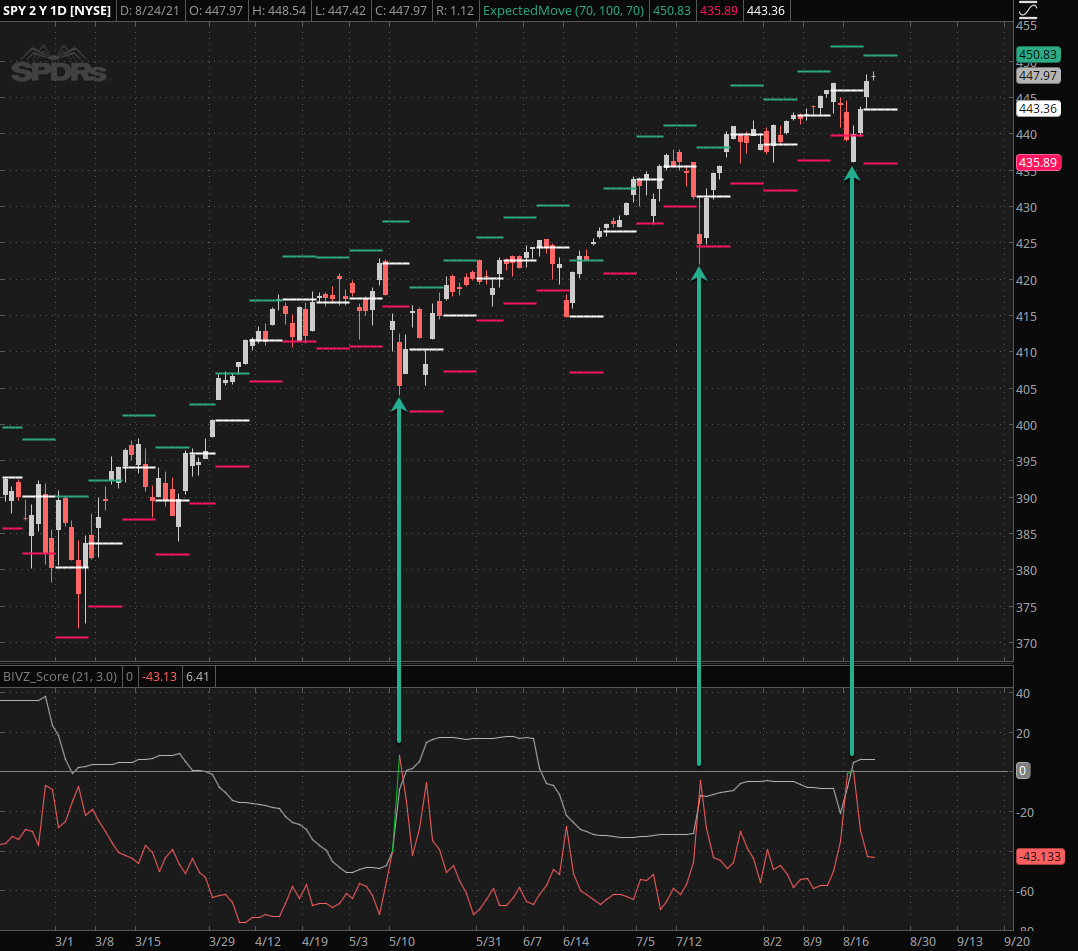
Now let’s get to the juicy stuff. As the geeky nerd in an Adonis body that I am I’ve hacked myself a Z-Score indicator for TOS a long time ago. But that wasn’t good enough for me.
Based on years of observations I had an inkling that wrapping a Bollinger around the Z-Score would be useful.
What I did not anticipate however was how spot on it would be when it came to flagging medium term bottoms.
Did. Not. Expect. That.
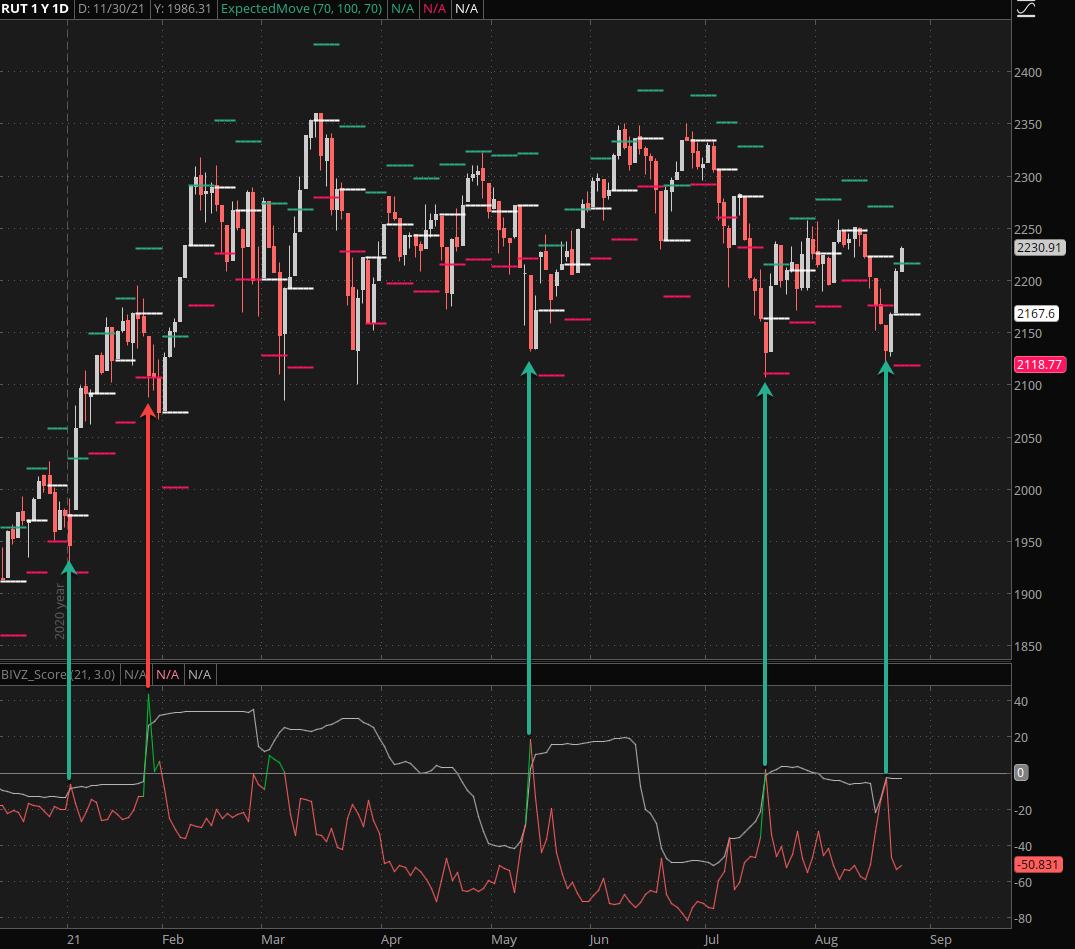
In fact it’s picking them like a runny nose. Does it work every single time?
Nothing does of course (see the red arrow) but it’s pretty close to perfection as it gets, at least in my book.
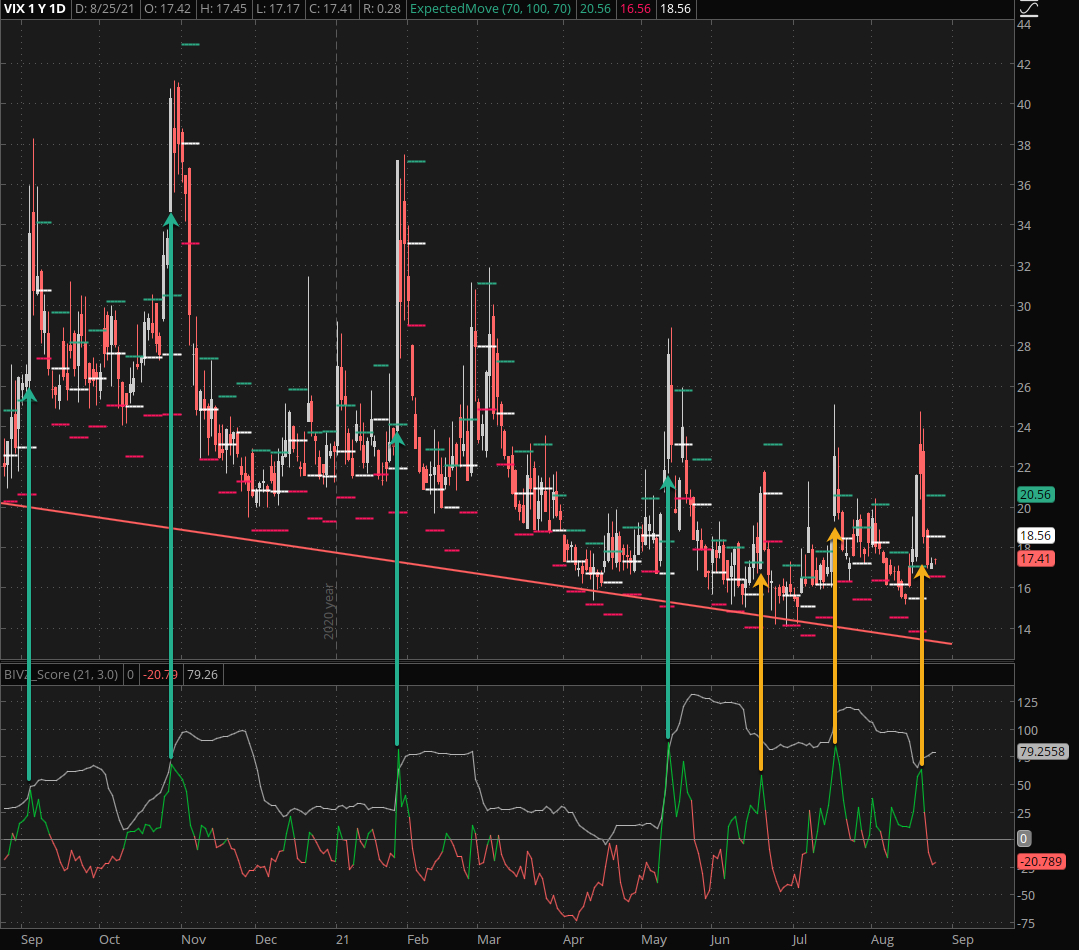
I threw it on the VIX and to me it looks like a slightly slimmer Bollinger would be better, but when it comes to trading implied volatility this is more than sufficient.
Bottom Line
If you are subscriber here then you’ll be seeing a lot more of the Z-Score indicator moving forward. So don’t be shy and rest in the knowledge that you’re part of the best effing trading site on the Internet. And you want it to stay that way right? 😉
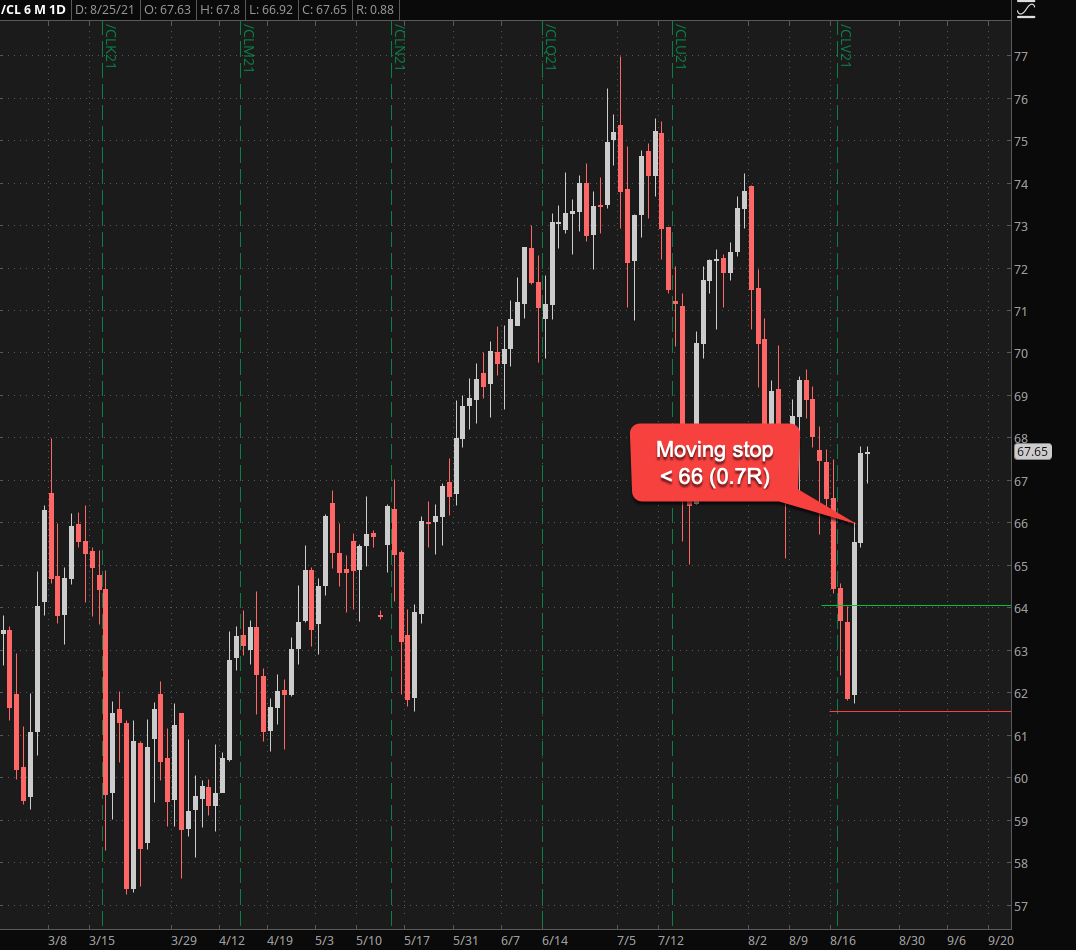
By the way I’m moving my stop on CL to about 0.7R.
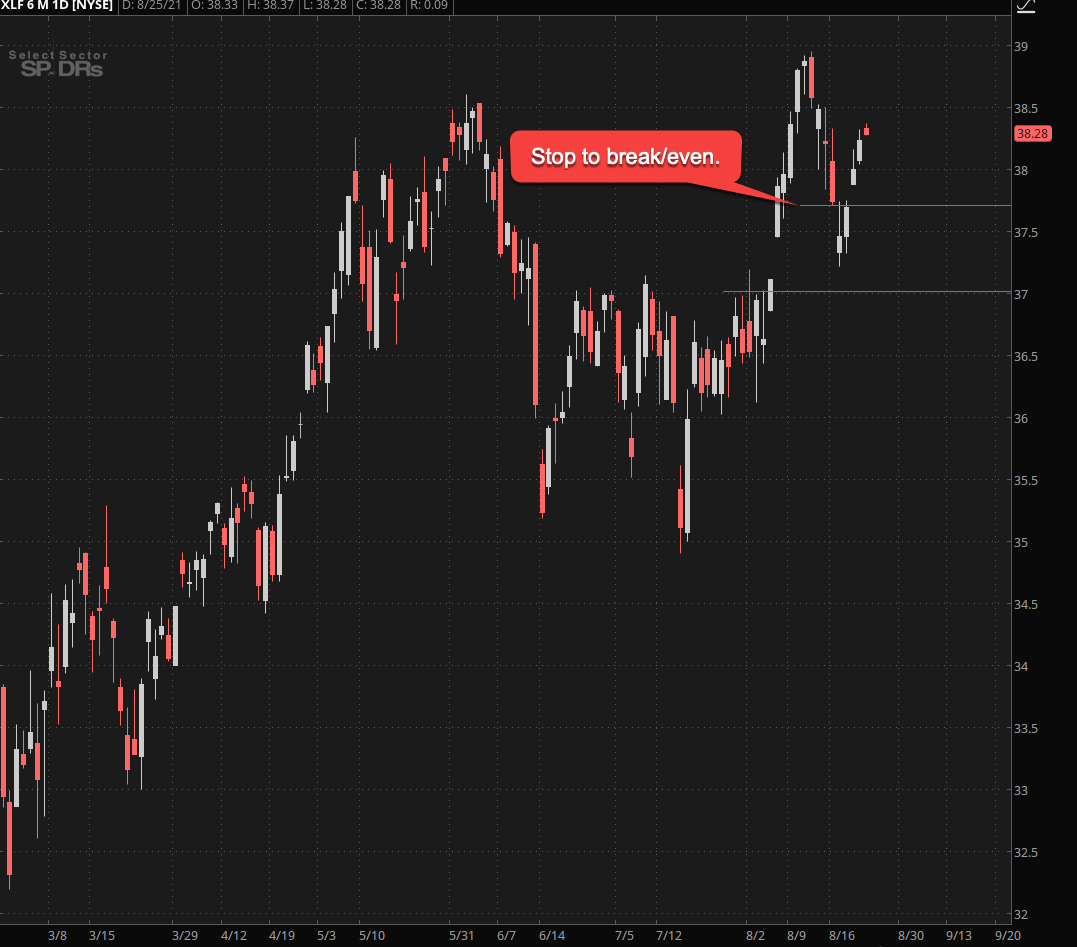
XLF is also looking peachy – here my trail goes to break/even.
Oh you didn’t see that setup? Well, you only have yourself to blame – so take measures to remedy this unfortunate situation.