In case you wonder, no I didn’t just pull that one out of my rectum, and yes it’s a real thing. In fact vomma is officially listed as one of the option greeks (check it out over on Investopedia). And it also happens to be one of the more exotic indicators of implied volatility that is very carefully monitored by professional option traders. And let me assure you that they are ALL keeping a very close eye on it this very week. But why?
First let’s understand what vomma is and why we should care. The concept is actually quite simple. You may recall that gamma measures the rate of change in the delta of an option with respect to changes in the underlying price.
If you didn’t know that then don’t fret – it’ll all make complete sense to you in a second.
Basically vomma measures the rate of change in respect to changes in an option’s vega, i.e. implied volatility. So while the VIX – or by extension vega – measures the expected movement in the S&P 500, vomma measures the expected movement in the VIX. That’s the key difference.
Effectively what we are looking at here is volatility in implied volatility, if that makes any sense. Which makes vomma a second order derivative of volatility.
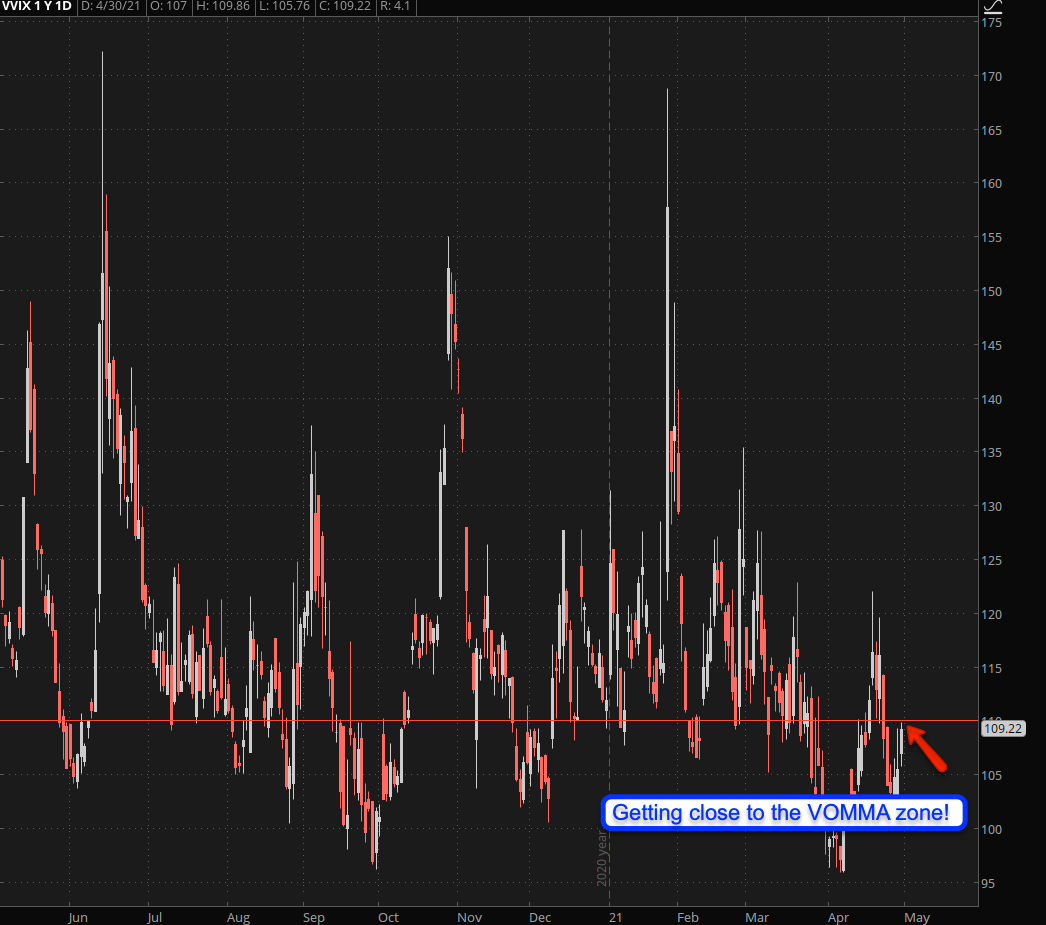
And that in turns brings us to the Vomma Zone. Among institutional option traders the line I have drawn at ~110 is considered a critical area for the VVIX that signals potential for major movement in the VIX and the SPX.
WHY that is I’ll explain further below plus I’ll tell you what usually happens when that line is crossed and what to do about it. Before we get to that let’s paint the picture a little bit as everything seems to be falling into place.
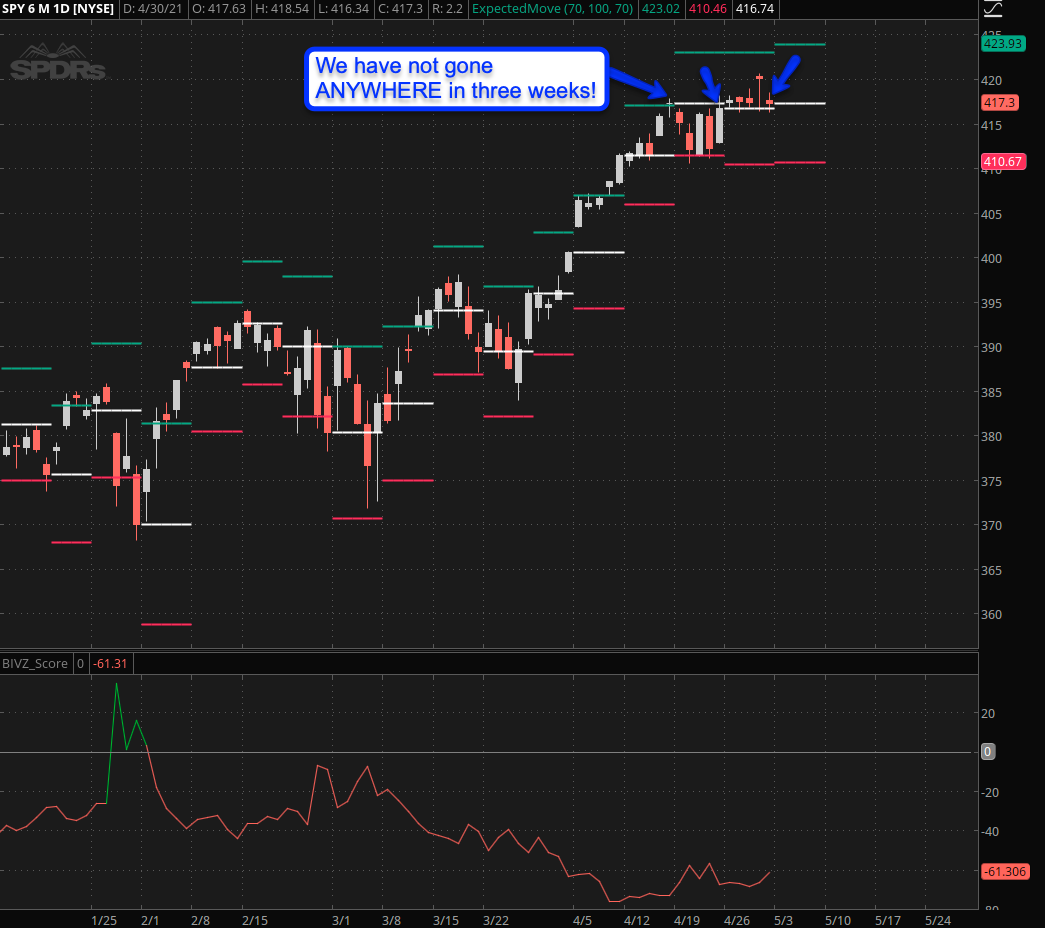
First up equities as a whole have been stuck in park (for non-Americans: that’s a setting in automatic transmissions) for the past three weeks. Which means that gamma risk is accumulating along with open interest around key thresholds of expected move (which also has barely moved for three weeks now).
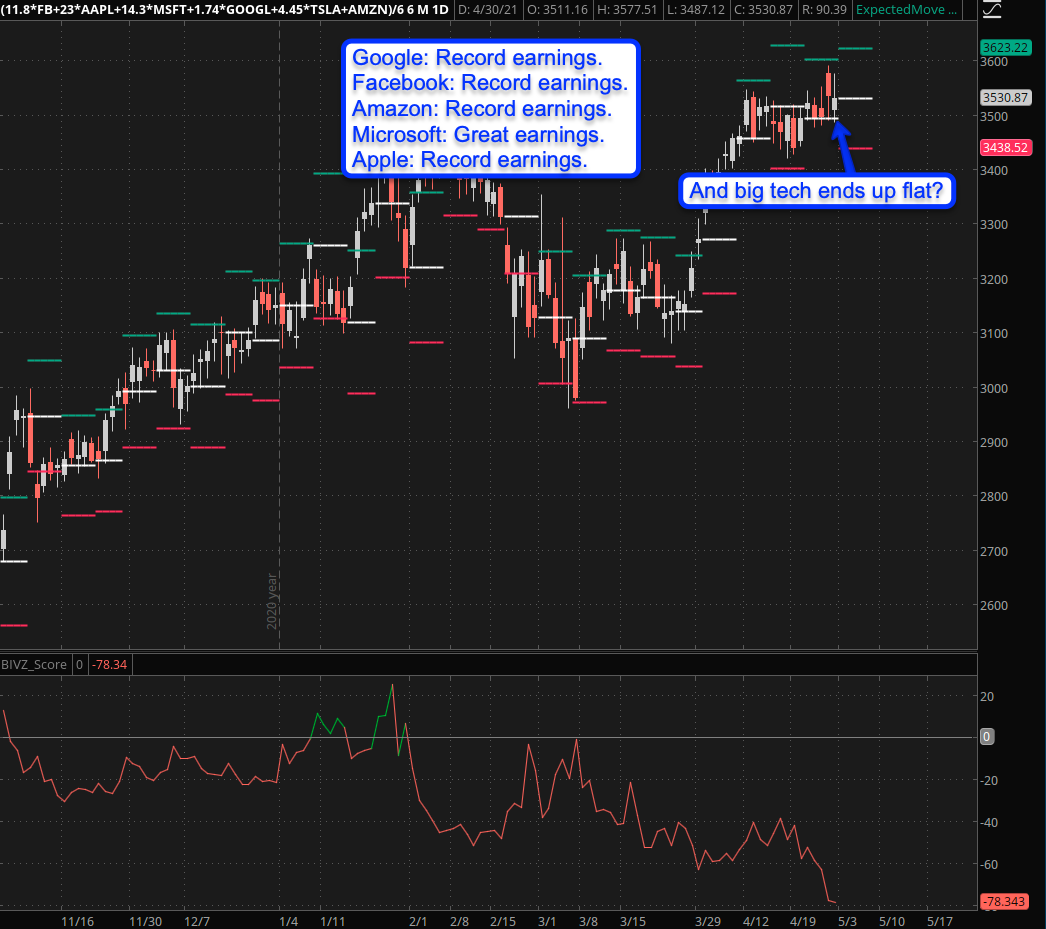
And why is that? If you have followed the recent earnings reports then you are aware that we’ve seen nothing but stellar reports with the entire cadre of big tech giants beating expectations and then some.
But you wouldn’t know it by looking at a pure price chart – the entire tech sector has been stuck in sideways gear and we saw quite a bit of selling pressure last Friday.
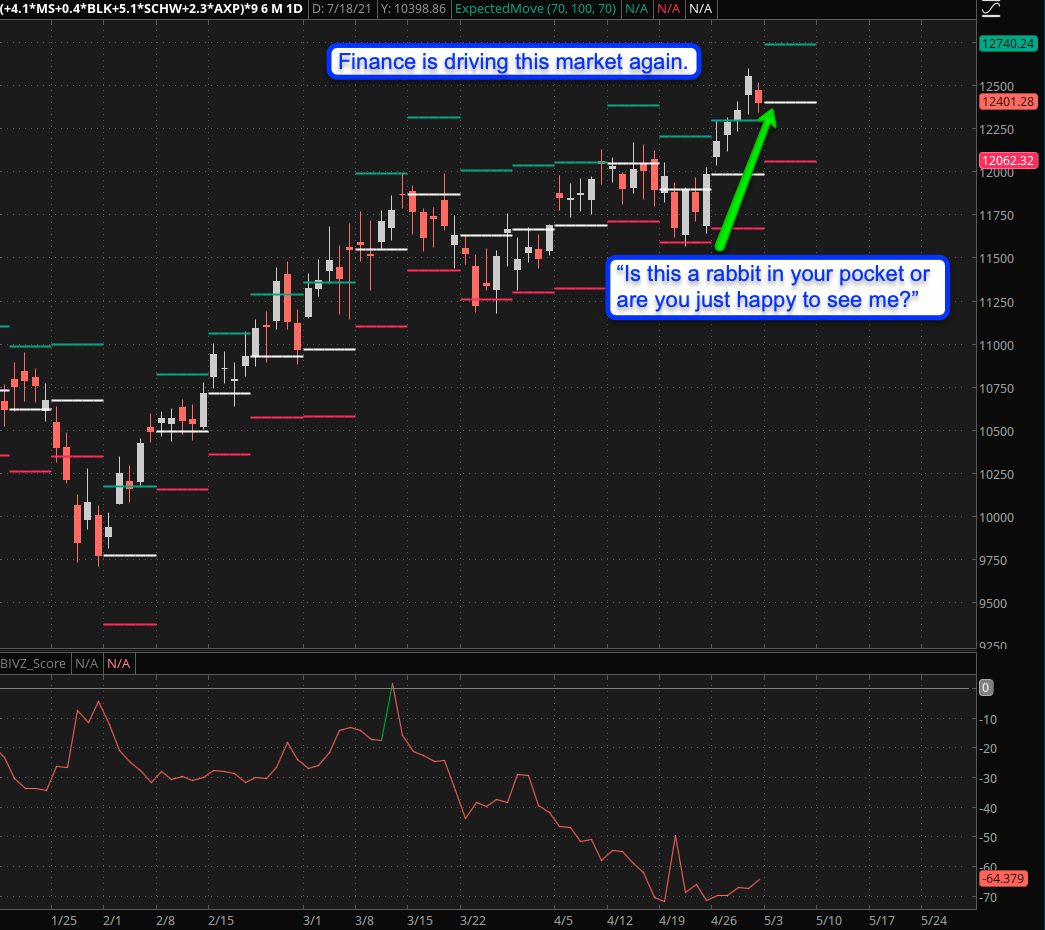
Which begs the question: What holding up this tape? And if you have followed me for a while then you probably have guessed it – the finance sector which was elated when the FOMC announced yet another nothingburger.
Which basically boils down to low interest rates and the Fed’s kitchen sink until kingdom come. Or in other words: moral hazard and record inflation have now become the defacto modus operandi of modern monetary policy.
Please log in to your RPQ membership in order to view the rest of this post. Not a member yet? Click here to learn more about how Red Pill Quants can help you advance your trading to the next level.
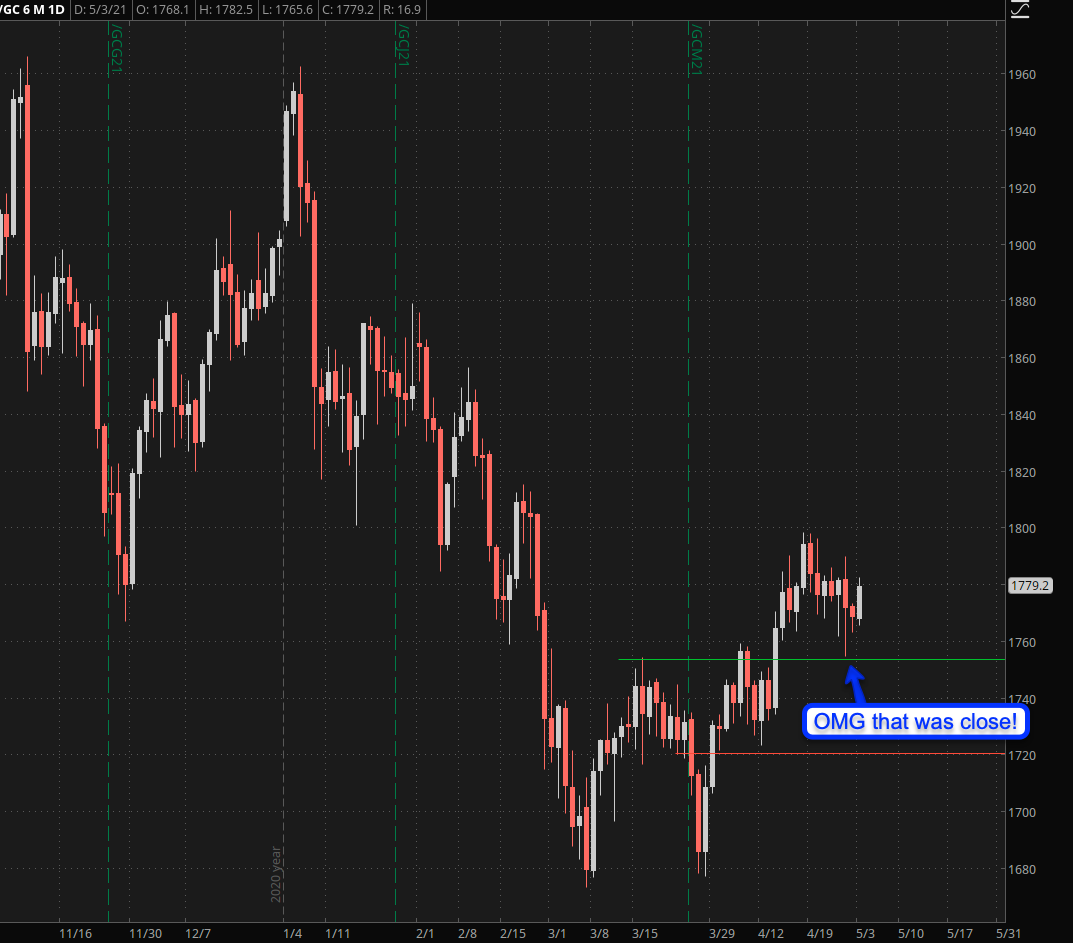
Before I run back to working on my 2nd webinar a quick update on our gold campaign. Oh boy that was a squeaker – one or two ticks lower and my stop at break/even would have been touched. More luck than skill obviously but thus far the formation looks like it may actually resolve higher.
Happy hunting but keep it frosty.