If you’ve been following implied volatility as long as I have then you know that backwardation is incredibly uncommon in the VIX futures curve. For the uninitiated amongst you, a futures curve or futures term structure is produced by drawing a graph comprised of a time window snapshot of two or more futures contracts of an underlying asset, e.g. crude, gold, pork-bellies, or in this case the VIX.
The ‘normal’ state of affairs in the VX futures is contango which is a nerdy insider term that most people I’ve met seem to be incapable of explaining properly. In a nutshell contango means nothing more than that the front month contract trades at a discount to the 2nd month contract, which in turn trades at a discount to the 3rd month contract, and so on.
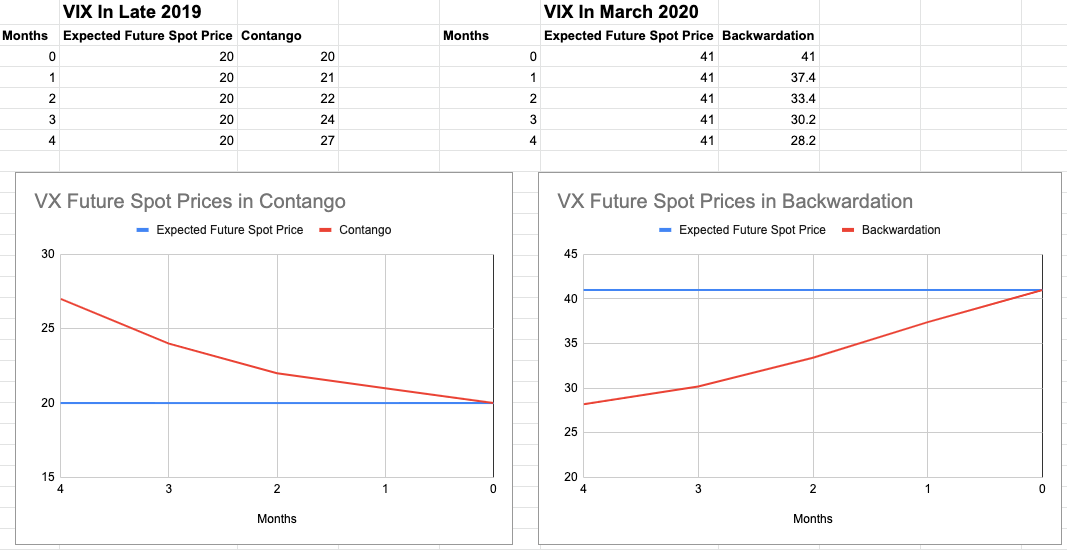
Backwardation as you probably suspected is the exact opposite. The front month contract trades at a premium to the 2nd month contract, which in turn trades at a premium to the 3rd month contract, and so on. This is the very situation we faced starting in March of this year and since then things have gotten even messier.
While most people scratch their head trying to figure out all that terminology someone out there has been banking mighty coin by taking advantage of the so called ‘roll yield’ inherent in backwardation which benefits savvy participants holding higher priced nearby contracts and ‘rolling’ them each month into lower priced more distant contracts.
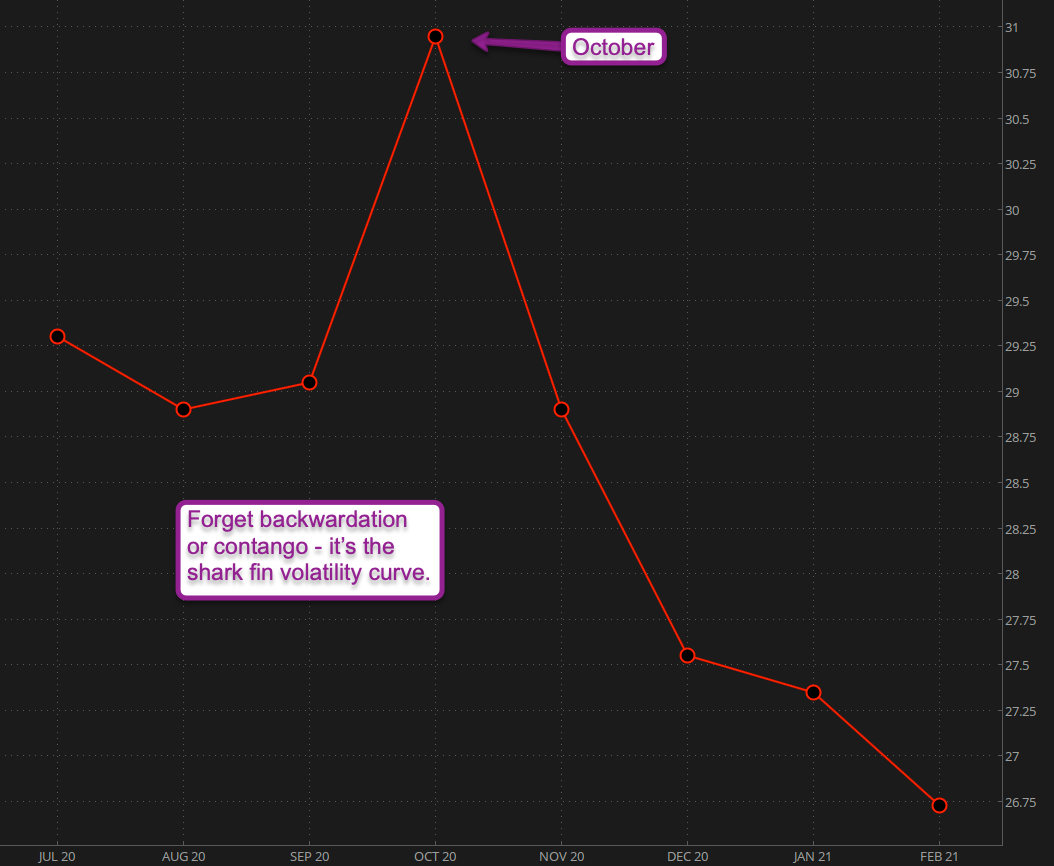
Until now that is as the roll yield racket just got a LOT more complicated. I am proud to introduce you to the new VIX Futures Shark Fin Formation (VFSFF®) which is guaranteed to make a quick meal out of any hapless options traders unlucky enough to enter its waters.
In all seriousness though, this is very important information we need to take seriously from a trading perspective, which really is all that matters. For one – if you cancel out Sept, Oct, and Nov then we are still in backwardation. Given that equities are three quarters into recapturing their all time highs (with the NDX already far above) this casts a bit of doubt as to whether we are truly back to conducting ‘bizns as usual’.
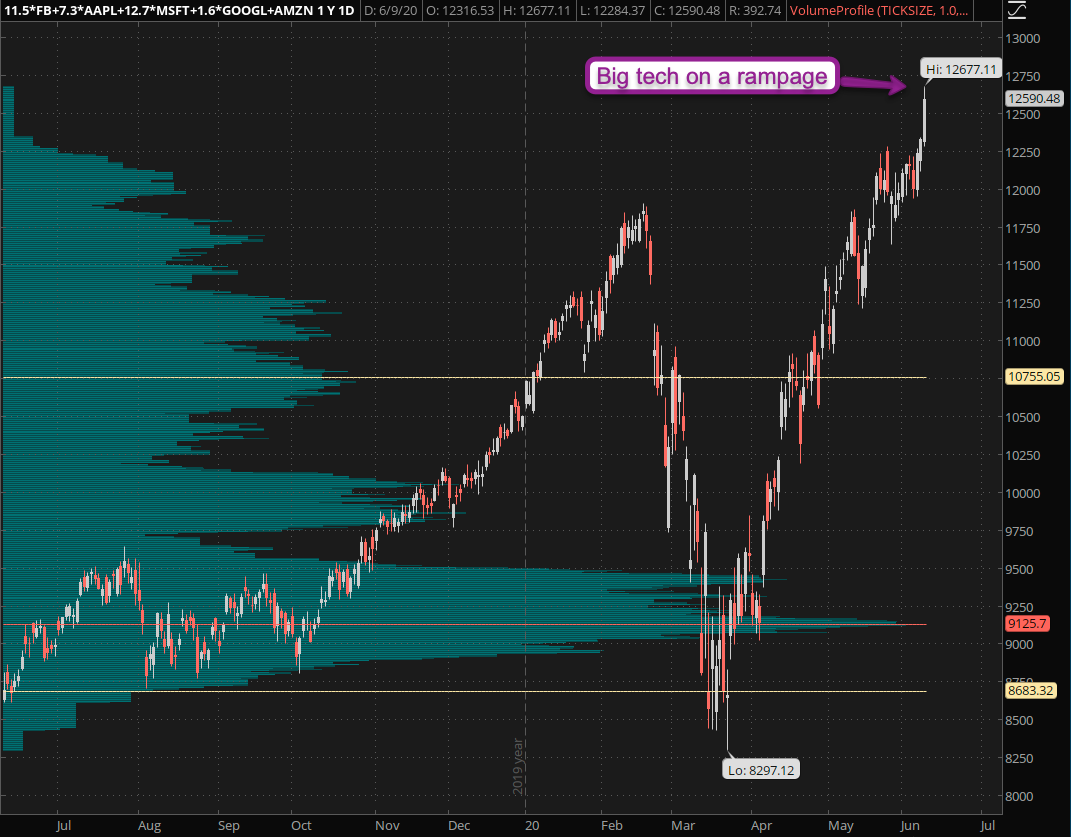
Let’s not forget that most of this rally is driven buy big tech. My own ‘monsters of tech’ composite has pushed into the stratosphere but does not seem to be running out of oxygen anytime soon. Will there be a pullback? Yes most likely but that’s something many already suspected several weeks ago, so be careful stepping in front of this speeding freight train.
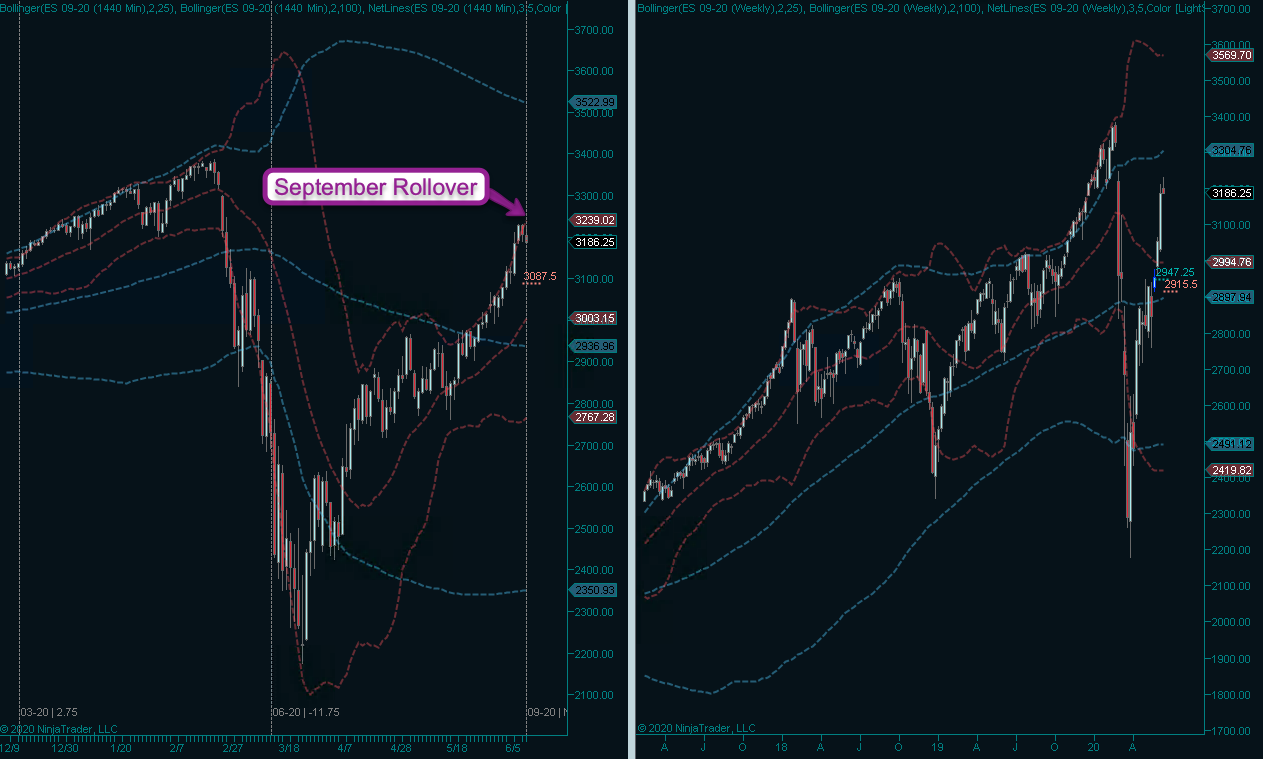
Here are the E-Mini S&P futures, which incidentally are rolling over today along with all the other E-Mini contracts (e.g. NQ, YM, and RTY). Talking about a v-shape recovery, someone should have send a memo to main street as well, which still is smoldering in many parts of the U.S.
To widen our general perspective let’s revisit some major major market verticals below the fold:
[am4show have=’p1;p13;p9;p12;p5;p10;p20;p29;p32′ guest_error=’login’]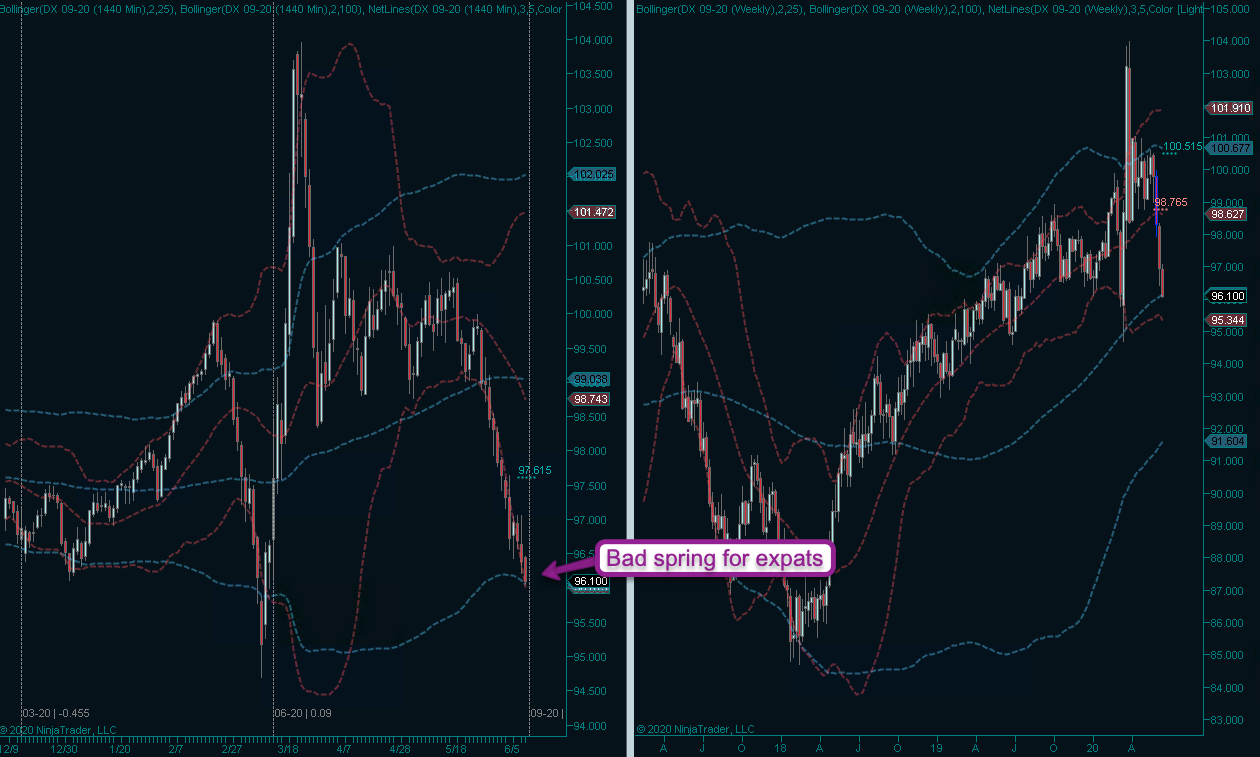
It’s been a tough spring for U.S. expats. In late April I was hoping that the triangle would resolve to the upside but it’s been nothing but red candles ever since. The lower 100-day Bollinger may offer some support especially since it’s supported by the 100-week SMA. However if it breaches lower then we may see the U.S. Dollar swirl the toilet for the remainder of the summer.
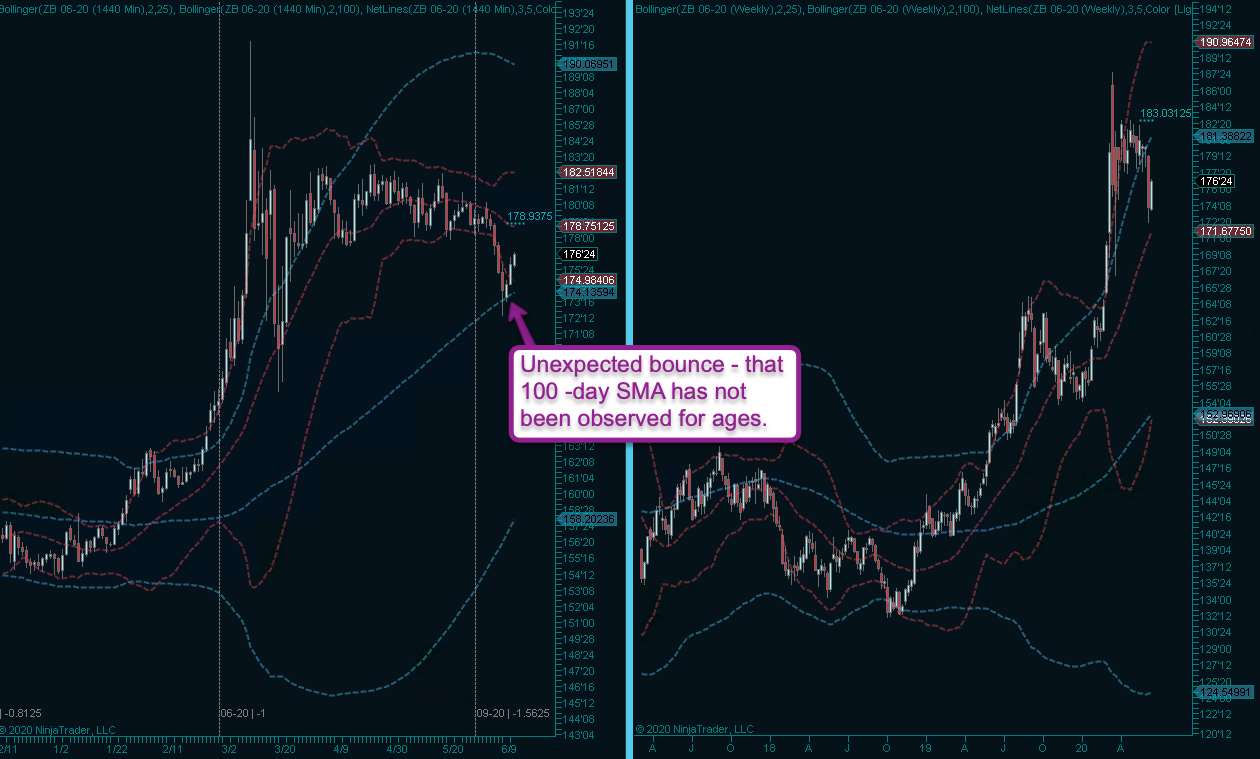
Bonds are bouncing for no particular reason whatsoever. That 100-day SMA touch most likely is sheer coincidence as it has not been observed/tested for ages. Otherwise I don’t see too much drama here right now. If a retest of the 100-day succeeds I may be coaxed into grabbing a few long positions.
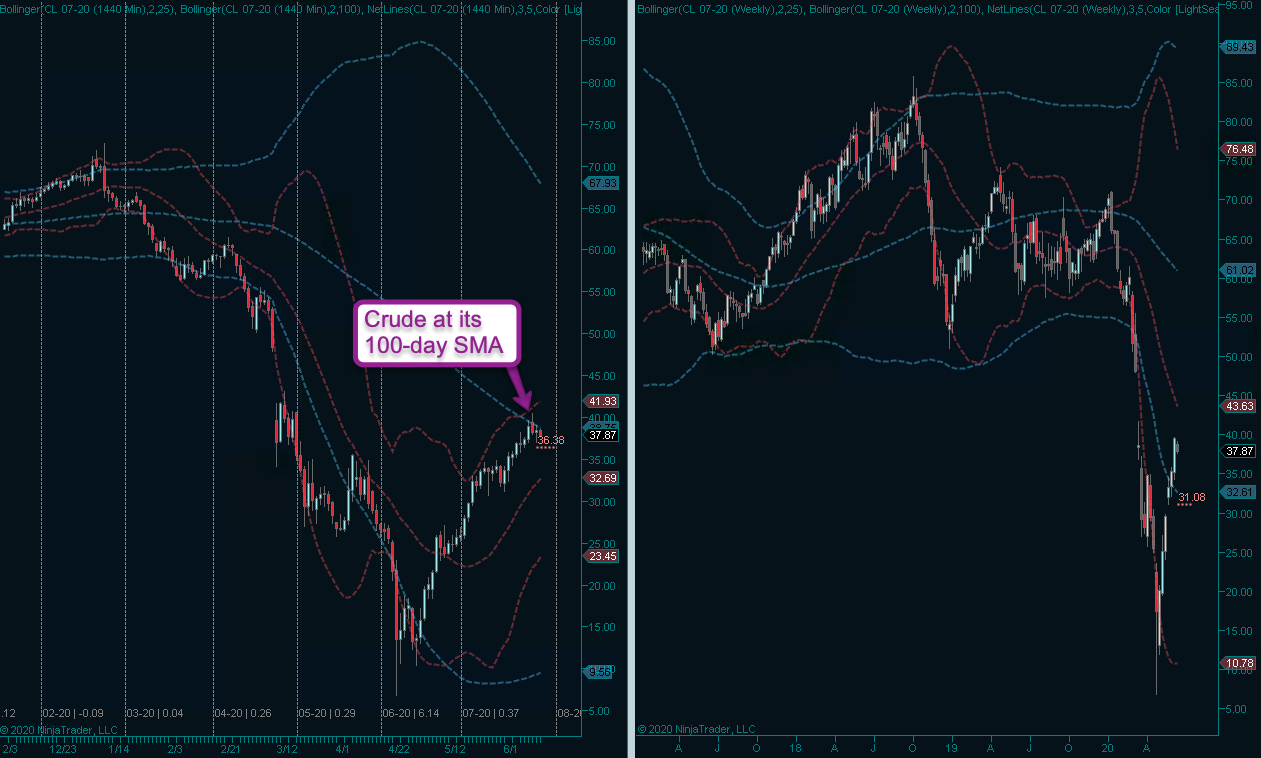
Crude has come a long way since it went quasi negative in late April. The first hurdle I see here is the 100-day SMA which – just like the one in bonds – has not been tested for a long time.
In general I see this as a growth market as the economy is going to continue bouncing back until about October when most likely all hell beaks loose due to the presidential elections and COVID 2.0.
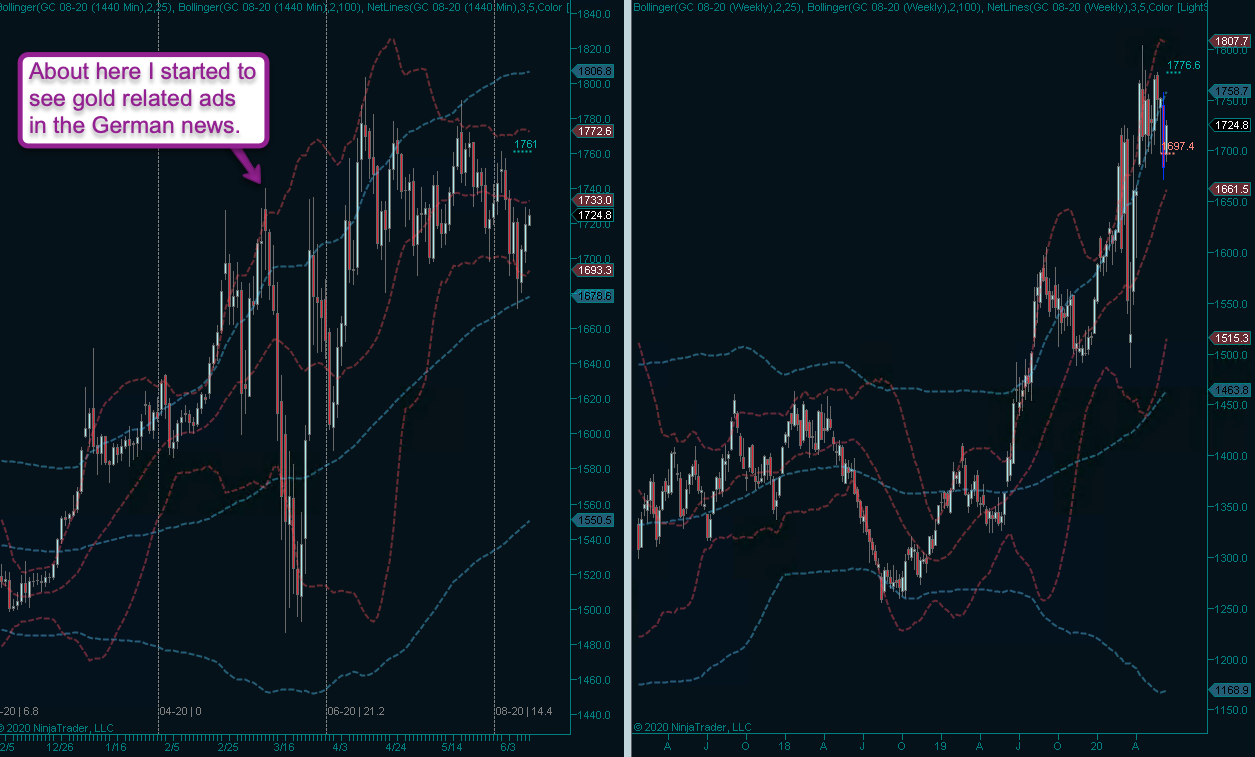
Gold also bouncing off its 100-day SMA – also untested but alas – and it’s not a market I’m very interested in. I lost interest back in February when it was on a ramp and I started to see a lot of gold related ads in German mainstream media (e.g. Spiegel, Welt, Süddeutsche, etc.).
That has been an almost perfect contrarian indicator as far as I can think – as soon as the German public is being led into investing in anything it’s time to get out. Yes I can say that as I’m German by birth. But I also grew up in Austria, so I get to make fun of them as well. The jury is still out on Americans and Spaniards 😉
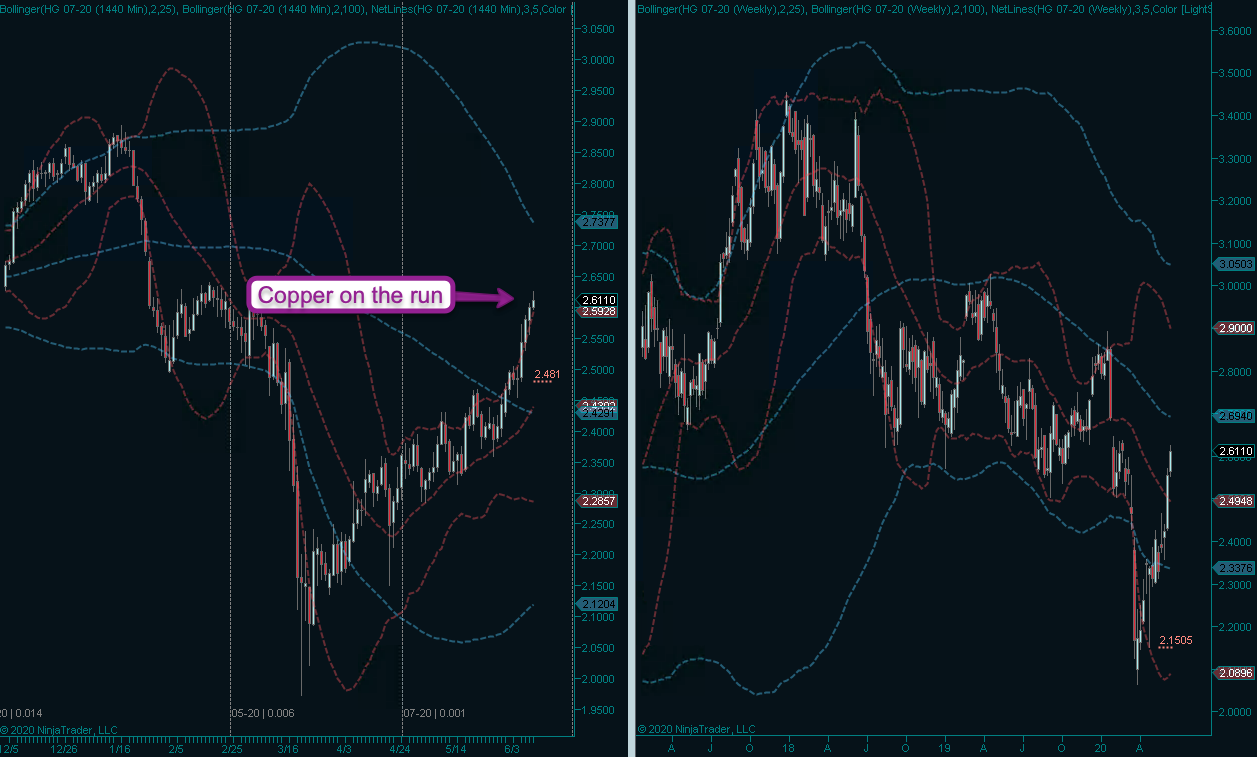
Copper – like many commodities has a tendency to run hard once it switches into trend mode. I don’t see this one slowing down until it hits about 2.7 where both the upper 100-day Bollinger and 100-week SMA seem to correlate.
[/am4show]