Welcome to the fourth most bearish week of the year, at least statistically speaking over the past 70 years. Seasonal bias has been touch and go over the past few years but it didn’t take a crystal ball to suspect that we’d be seeing some sort of correction during the onset of summer, and in particular after a record snap back rally that propelled us 1000 SPX handles in less than three months.
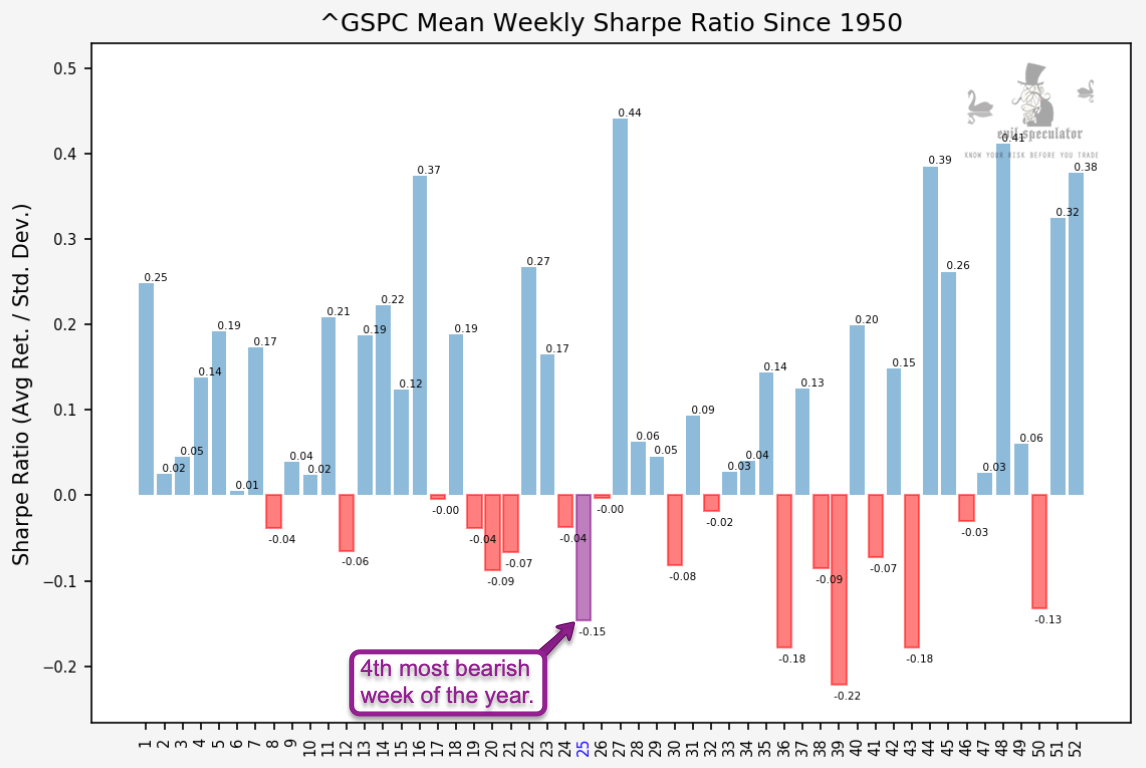
The weekly Sharpe ratio shows us us a yield of -0.15 which is only beat by a cluster of bearish weeks in September and October. If you recall the VX term structure is already accounting for a bout of volatility during that time.
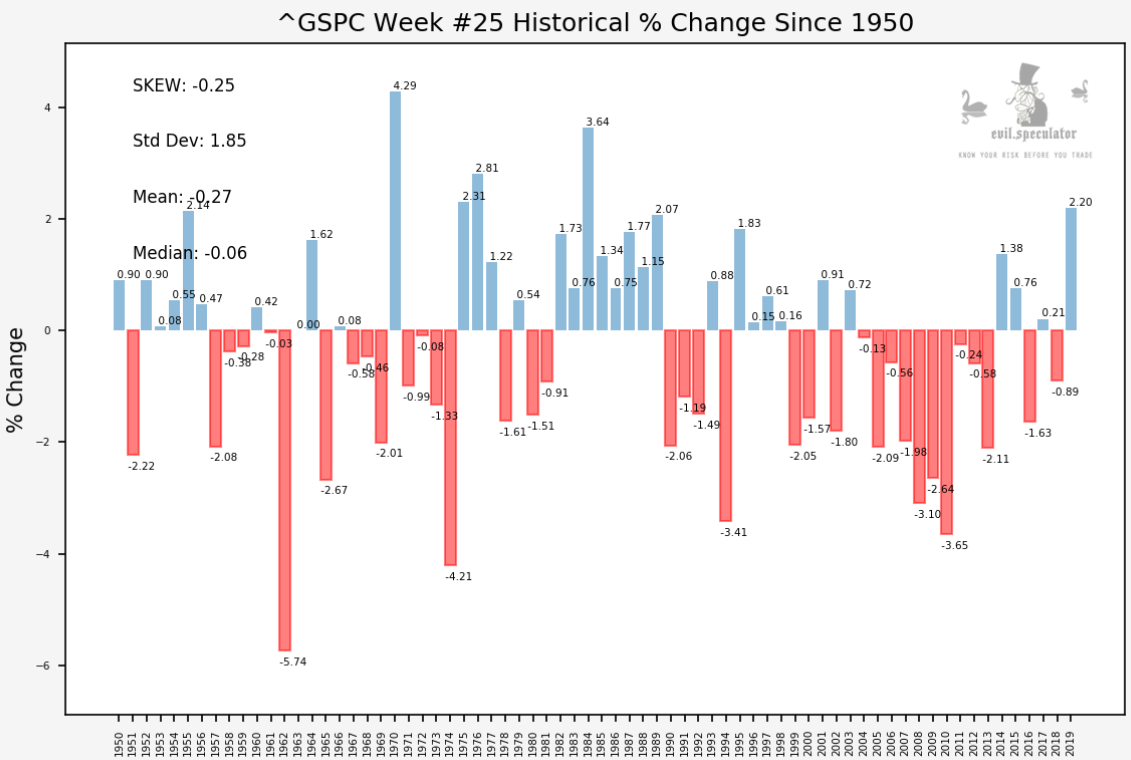
SPX historical percent change shows us the entire data set for week #25 plus a few stats in the top left. But it doesn’t take a degree in advanced statistics to figure out that we’re looking at seasonal headwind here.
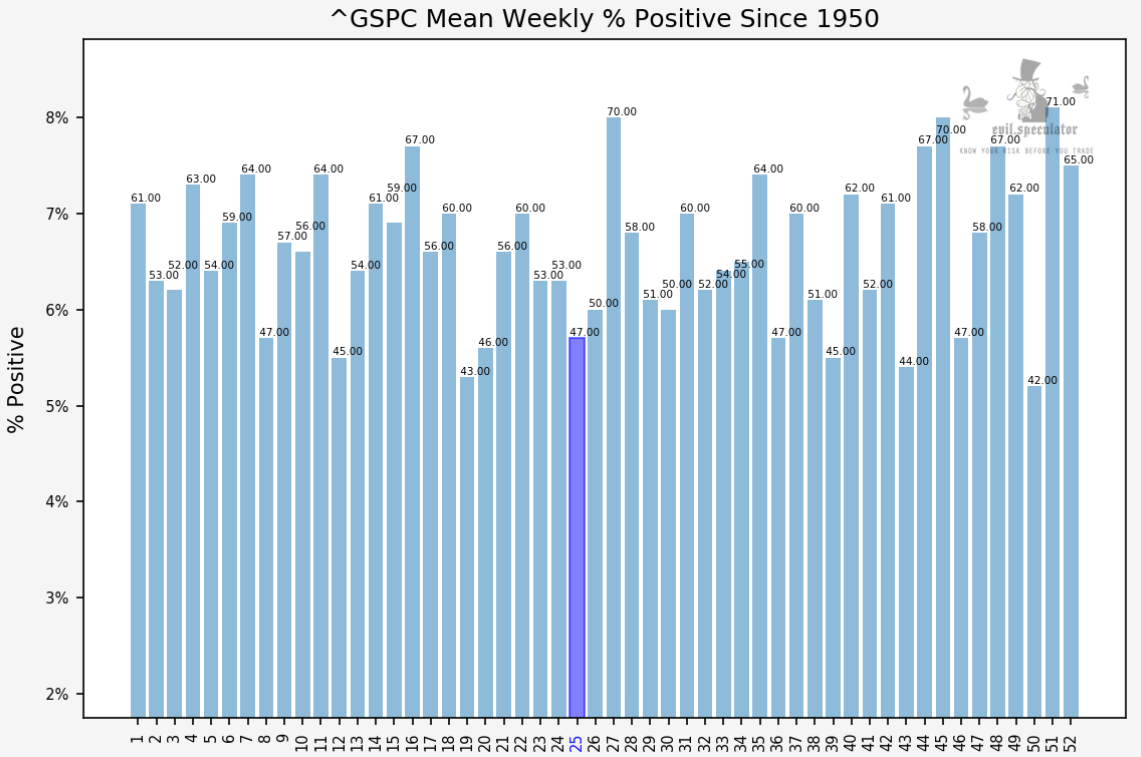
SPX weekly percent positive at 47% – that’s not the worst but when things get out of hand they usually slip significantly.
Please log in to your RPQ membership in order to view the rest of this post. Not a member yet? Click here to learn more about how Red Pill Quants can help you advance your trading to the next level.