It’s difficult to explain it all in layman terms, but I’ll give it my best shot. None of what follows below should be taken as chiseled in stone and it’s only my personal theory. As always do your own research, and if you come up with a better theory be sure to let me know.

- LUNA and UST are crypto coins that were related to each other in a 2-token model. $1 worth of LUNA could always be converted to $1 worth of UST, and vice-versa.
- The thing is, UST coin was a stablecoin that always pegged at $1 USD, meaning $1 UST = $1 USD, and which could also be converted to $1 worth of LUNA.
- Most importantly: The team behind LUNA also used Bitcoin as a backstop in case the value of UST dropped below the peg price of $1 USD (make a mental note of that).
- Long story short, a large amount of UST was sold at once to destabilize the $1 USD peg, which then relied on the BTC backstop, which then also fell through the floor, and caused the entire system to death spiral into oblivion. Thanks a lot LOONA!
- The end result was LUNA losing billions in market cap and over 99.7% in just a few days.
Now this is important: Due to aforementioned USDT toilet flush 88,000 BTC owned by the Luna-circle-jerk-foundation got rapidly transferred to various exchanges.
![]()
Keep in mind that before you can sell a coin you have to first send it to an exchange, so smart traders monitor this to see when collapses and waterfall declines can happen.
On the chart above you can see clearly when the proverbial excrement was about to hit the turbo jet.
Now get this: Of the 88,000 dumped on the market 80,394 BTC came straight from the Luna Foundation Guard, so only an extra 7600 BTC was from other people freaked out by this.
Imagine for a moment selling 80,394 perfectly good BTC and then using the money to buy UST which is now virtually worthless.

Possibly the dumbest financial move of all time. A true gold for magic beans situation.
What’s rather compelling to me is that despite a full blown market banana slip, only 7600 of real people’s bitcoin made it’s way to those exchanges. Meaning bitcoin held up better than you might have expected in such circumstances.
Alts of course didn’t and effectively got taken to the whoodshed, but alts always take it in the rectum during downside markets.
Still, bitcoin broke the long standing support at the July lows. Which triggered a heap load of stops. And the rest as they say is history.
To add insult to injury the spike in FUD and the crash in UST caused Tether to de-peg. Effectively people were freaking out about a second stablecoin potentially collapsing but fortunately Tether is more robust than anyone thought.
Tether thus far has weathered the storm, but did go as low as .95 to the dollar. The “better” stablecoins went up as people paid a premium to hold the safer stablecoins.
So where are we now?
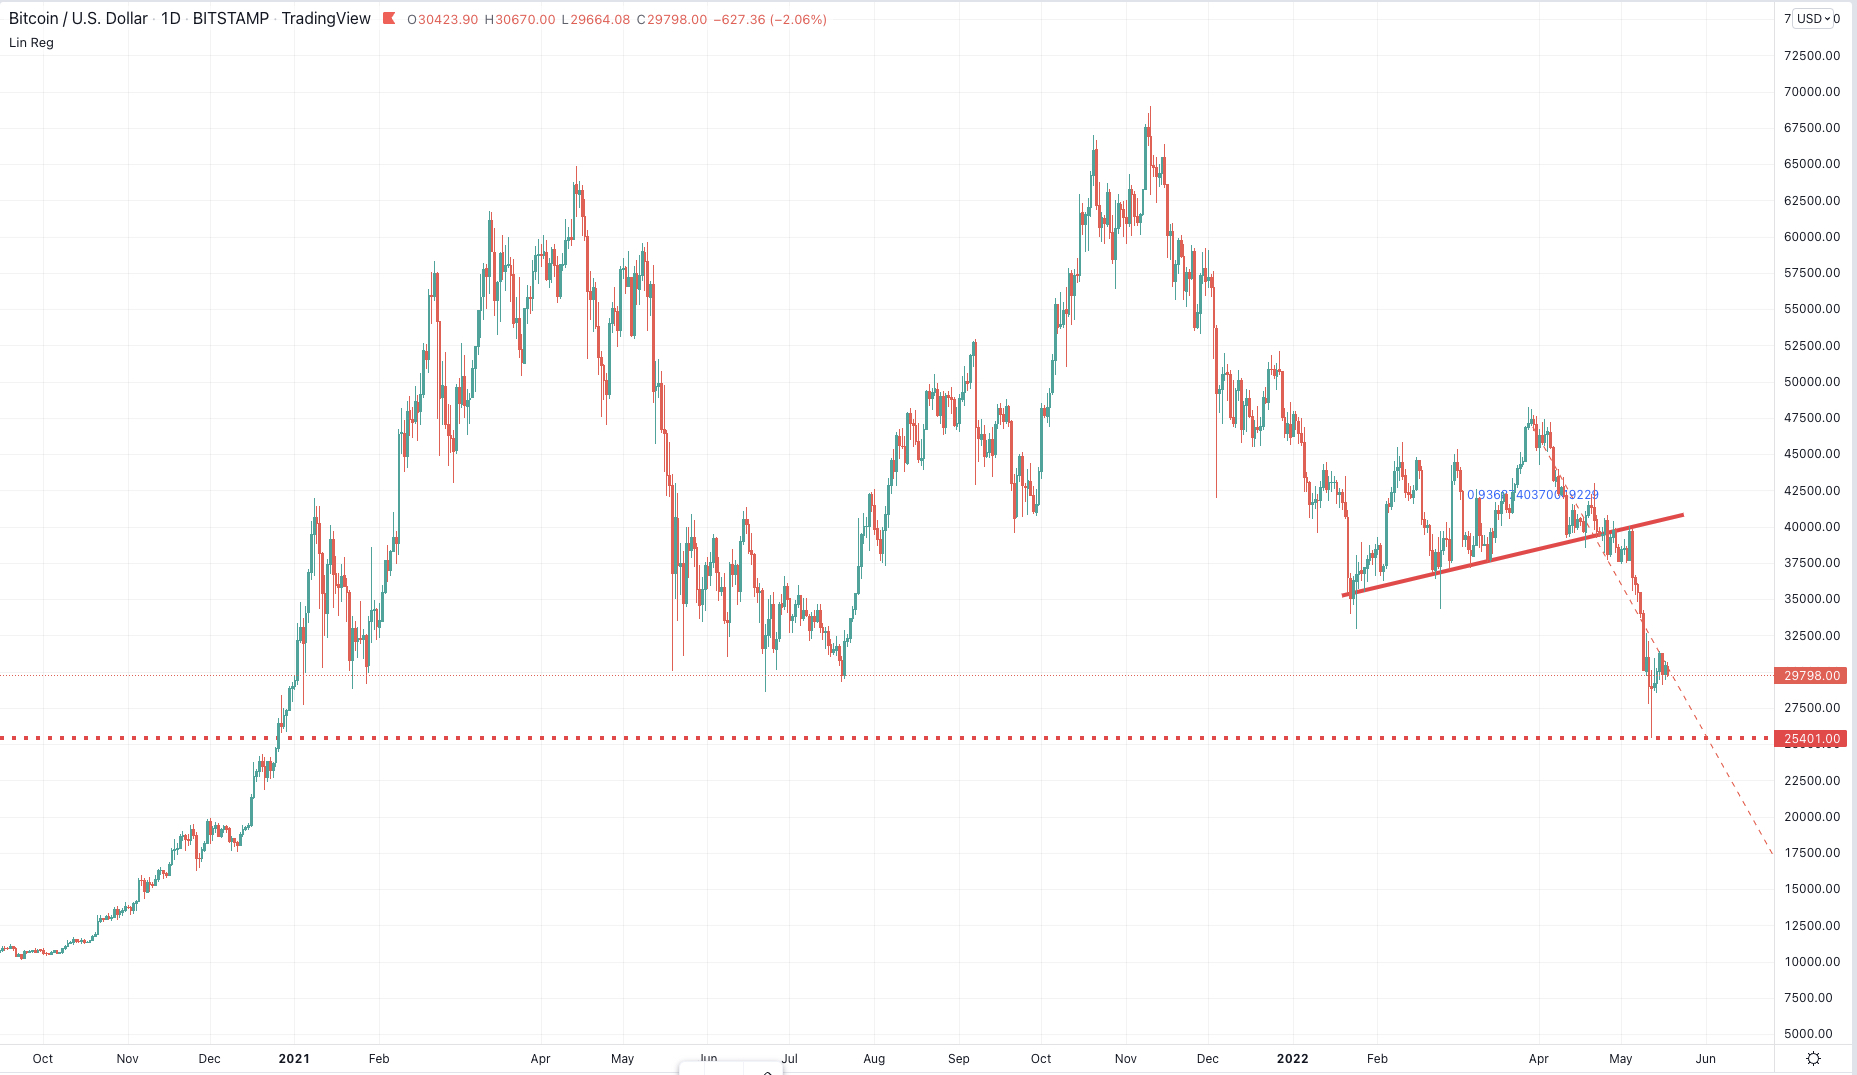
A drop below the red dashed line will surely be met by instant panic selling.
I’ll be buying with both hands if that happens.
Above the red dashed line we have two scenarios. The most bullish but lower probability outcome is a V bottom, BTC shakes off all the voodoo needles and rallies hard.
Alts would probably continue to lag for a while, but that is to be expected as altcoins are a risky investment and nobody’s feeling risky-frisky at this point.
The highest probability I see at this point is a slow, boring grind back out of trouble.
What I suggest you do is examine every bit of new evidence to see which of those three scenarios (puke lower, grind higher, V-bottom) are more in line with reality as it unfolds.
Or you can just read your my posts. I’ll be doing it for ya’ll.
P.S. As you know I’m working on a new perpetual crypto futures trading system, which is based mainly on my time tested Net-Lines indicator as well as a novel concept I recently introduced called the Kalman Filter.
In fact the Kalman Filter is one of the most important and common estimation algorithms in existence. It is widely used to find the best estimate of states by combining measurements from various sensors in the presence of a lot of noise (e.g. think thermometer from hell or a discount altitude sensor from China).
The way it does this is via estimates of hidden variables based on inaccurate and uncertain measurements. Also, the Kalman Filter provides a prediction of the future system state based on past estimations. It’s extremely cool stuff in an even more extreme nerdy kinda way.
So why should you care?
Simple. A few years ago, after learning more about the Kalman Filter, I wondered why nobody had ever used it in the realms of finance. I came up with three theories:
- Nobody ever thought of doing it. Given that there are nearly 8 Billion contemporaries crawling around on the planet I found that notion implausible.
- It’s been tried and it just doesn’t work. Well, that’s easy to figure out right?
- It’s been implemented and it works so well that it’s being kept a close secret.
Call me an optimist but I had a strong inkling that door #3 may be in play, so one rainy weekend I sat down and implemented the Kalman in C# as an indicator for NinjaTrader 8:
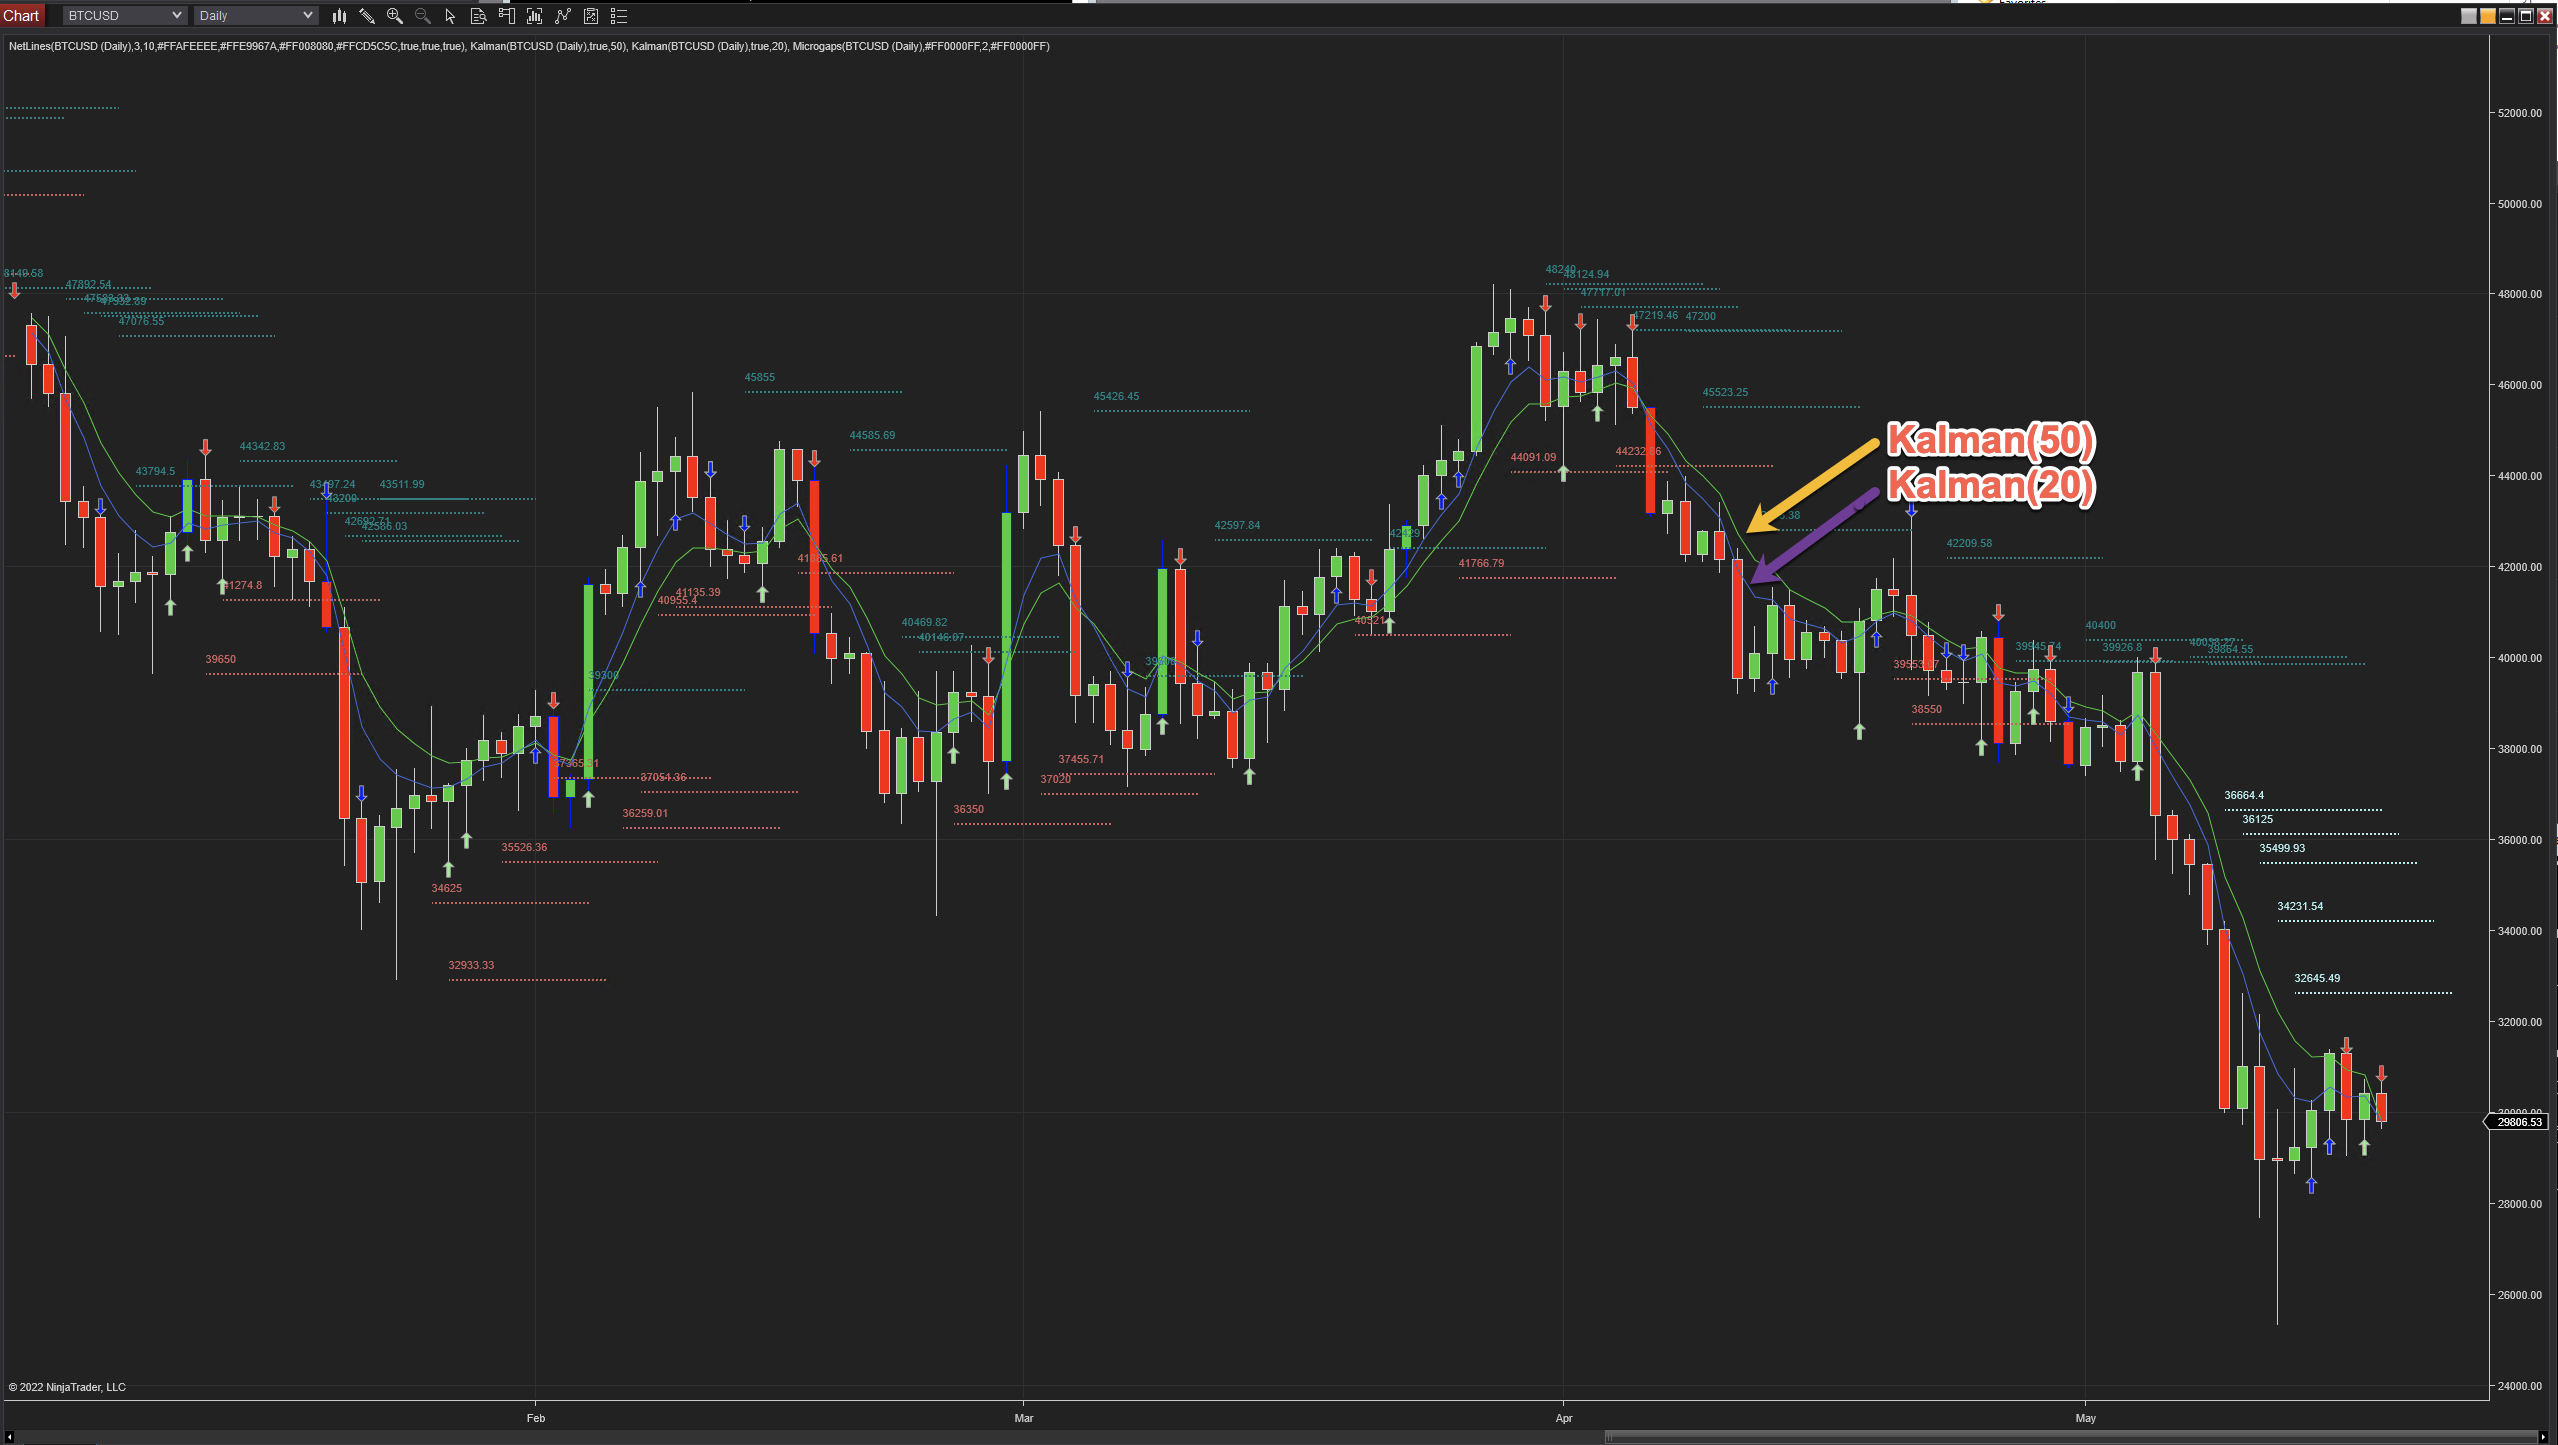
The Kalman doing its thing
That was a few years ago and since then I’ve used it internally with much success, strongly suggesting that my instincts about its utility for plotting an accurate and less noisy trend direction (in comparison with e.g. moving averages) had been spot on.
Unfortunately I lost my Windows setup when I migrated to an M1 Apple fanboy machine sometime last year, but I recently recovered my code and it’s running on my VPS now.
So what does that mean for all of us?
For one it’ll allow us to plot medium to long term trends (e.g. 120 Minute and up) very accurately. For proof of that look no further than the screenshot above which shows two Kalmans in action.
A regular moving average (EMA or SMA) would have been cut to pieces in tape like this but the Kalman keeps us in the game when it matters the most (i.e. trending tape) and affords us responsive guidance when things start going sideways (the known Achille’s heel of moving averages and indicators in general).
So there you have it. I plan on trading it manually for a while and if it keeps up the good work I will introduce a signal service on daily charts that helps us navigate the swings with much higher precision.
Finally I plan on making it available to all Cryptonaissance subscribers in order to provide us with a more fine grained trend filter for trading medium term swings.