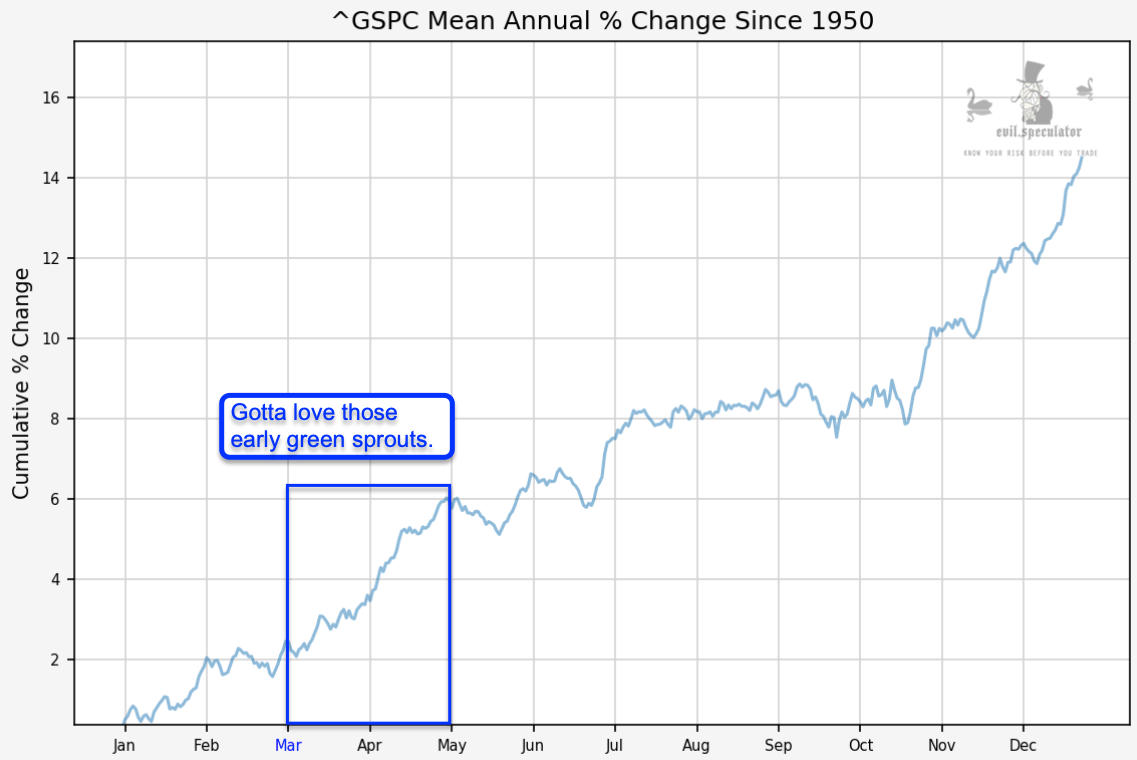
It’s been almost 30 years since I’ve lived in Northern Europe and among several personal reasons a major incentive to leave for warmer climates was that I don’t care much for six months of non-stop crappy weather. The are two things I absolutely miss every single year however. One is a white Christmas (yes, I’m hypocrite) and the other is a real spring, especially early spring when the snow begins to melt and the first snowdrops push their tiny heads through the remaining vestiges of snow. And based on the numbers it also happens to be a good time for equities. So let’s review the freshly updated monthly stats for March.
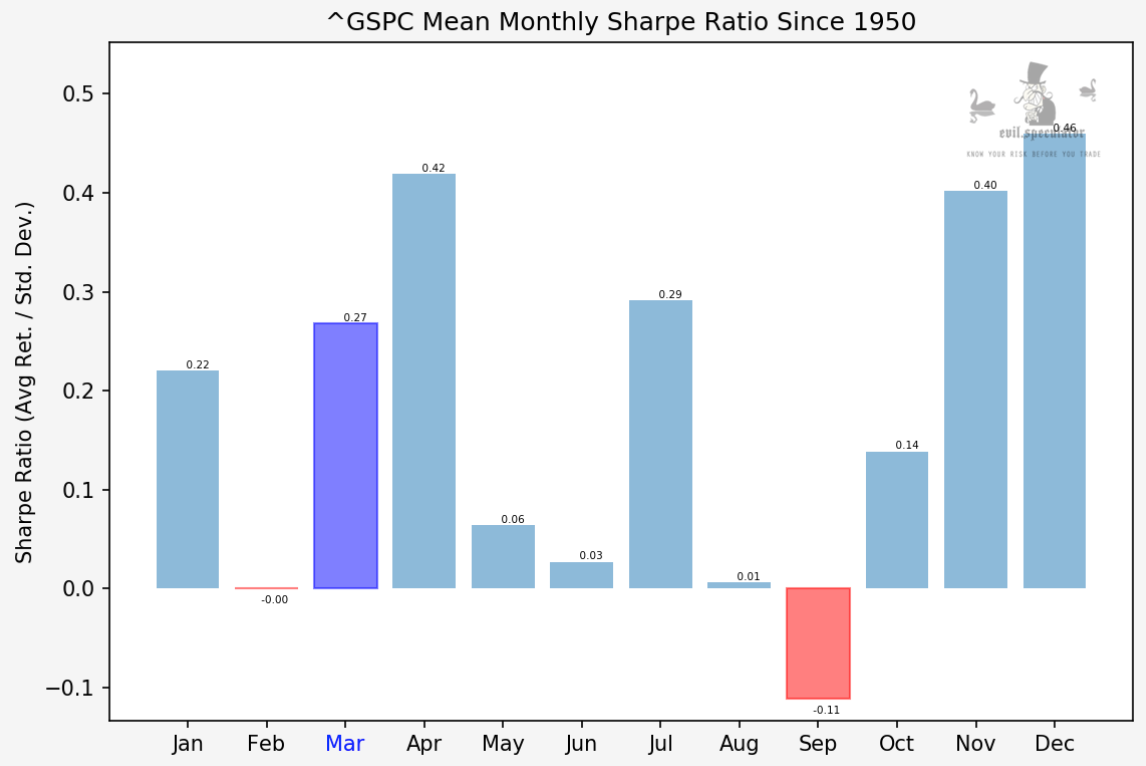
Let’s start with the easy stuff first, which of course is the Sharpe Ratio. It stands at 0.27 and thus ranks 5th out of 12. Not bad but obviously how we get there is equally important. Let’s drill deeper.
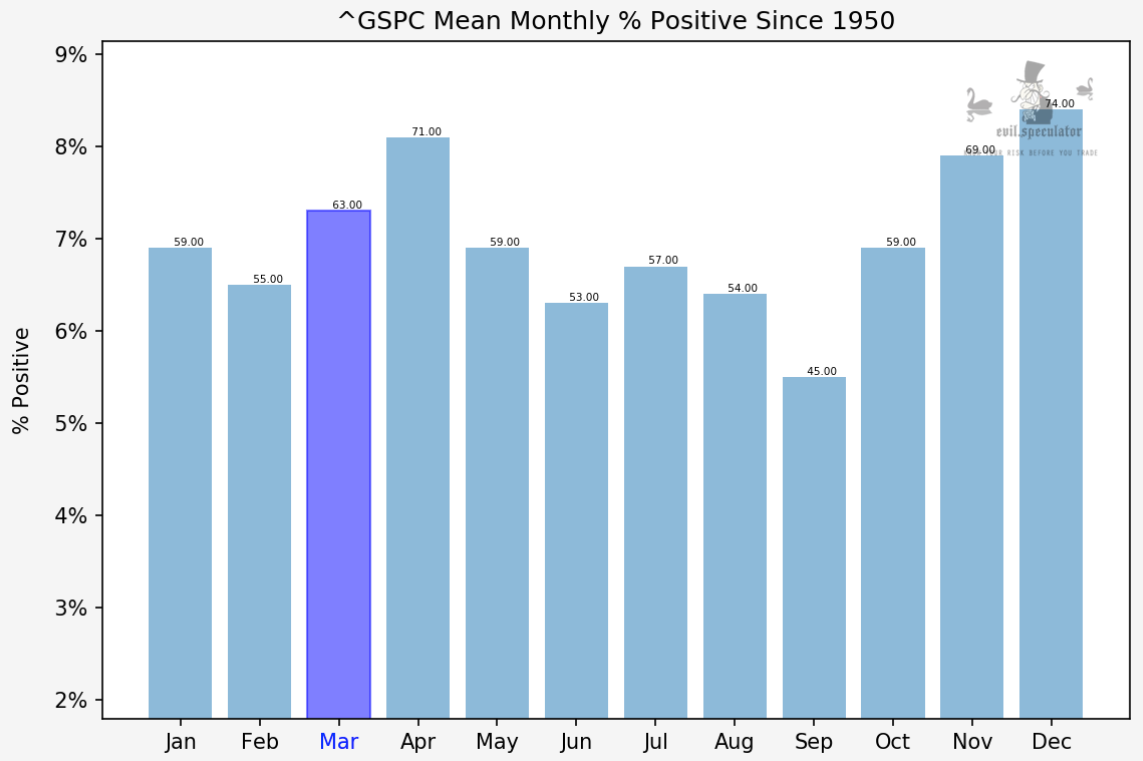
Mean monthly percent positive comes in at 63 and that’s pretty damn good – the 4th best in fact.
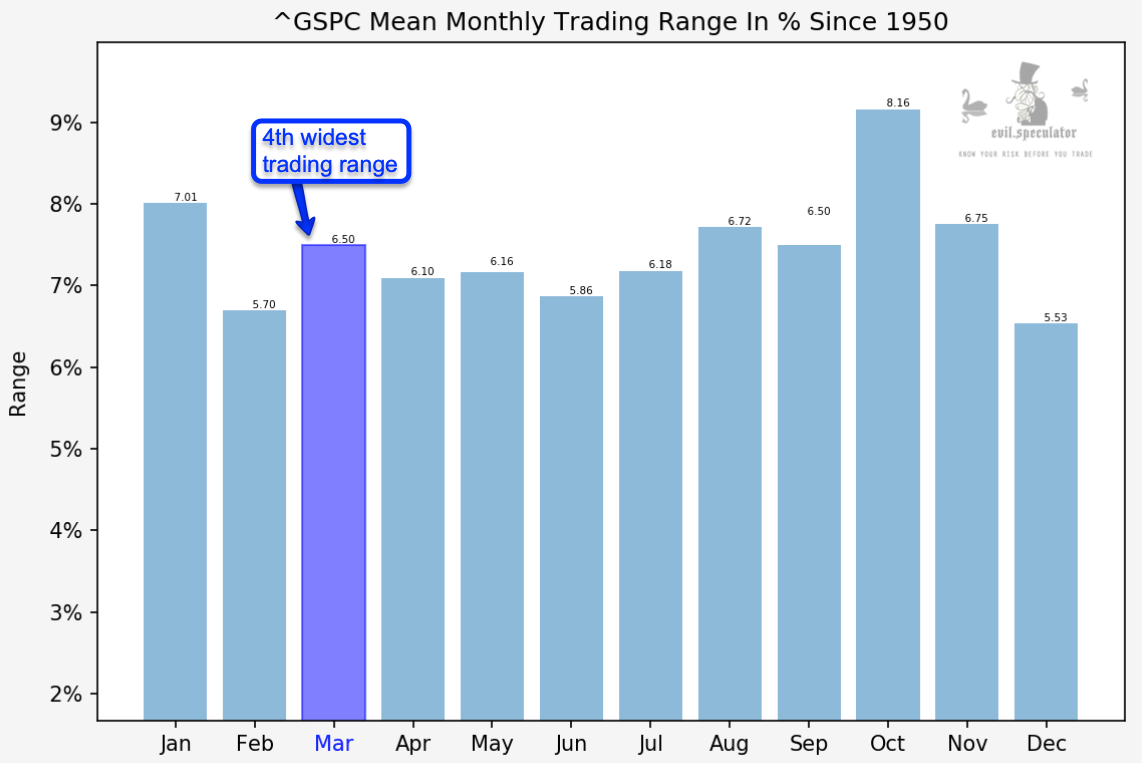
It’s also in the top four when it comes to trading range, which may be a good or a bad thing. In this case I think it’s mostly the former judging by the next graph:
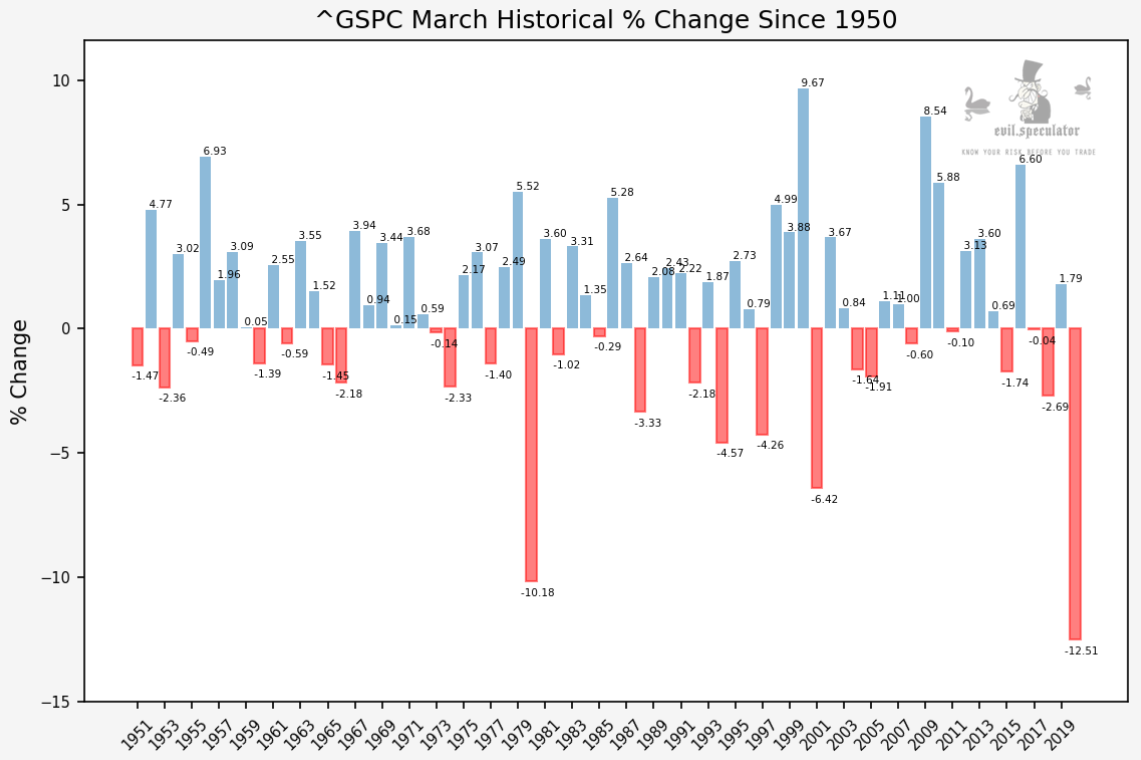
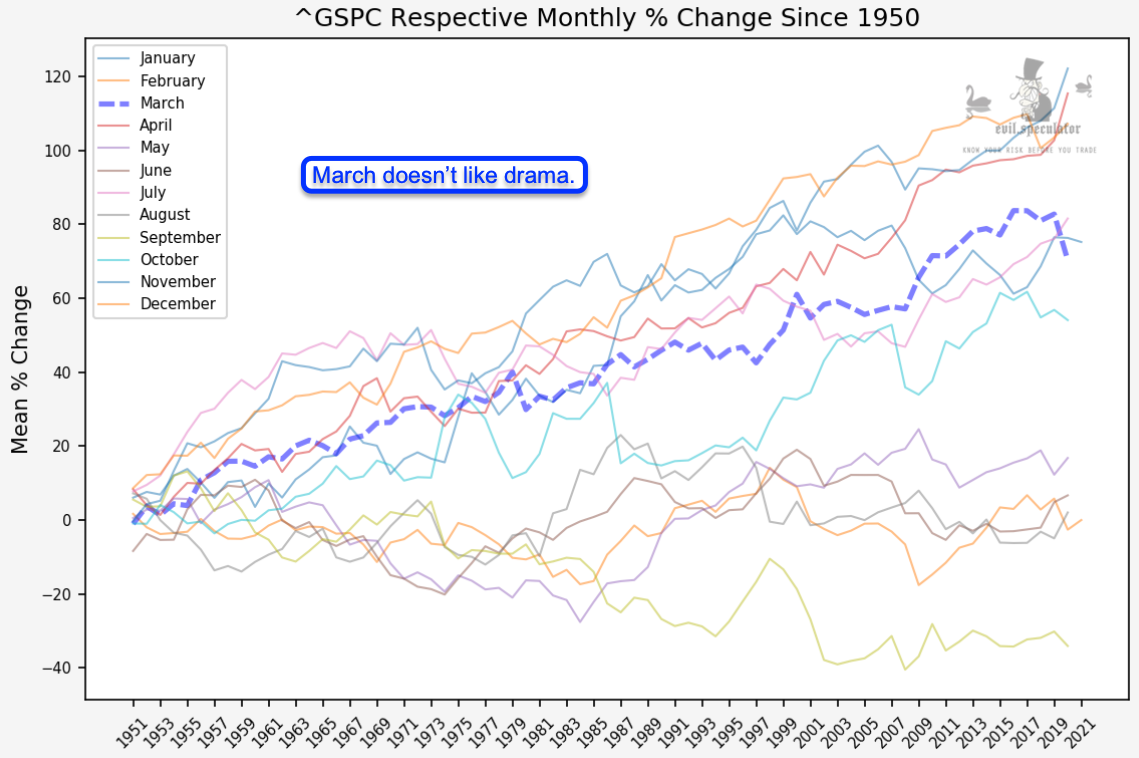
Which is the full monthly lineup since 1950. On average we clearly see a positive bias here but it comes with a caveat. Every once in a while it seems the market slips on some black ice and paints a wipeout. Last year comes to mind and a similar event occurred back during the Carter years.
But on average you just can’t say no to March when it comes to investing in or trading equities. Had you done nothing else but bought the SPX on March 1st and then sold on the 31st you would have most assuredly been profitable, no matter when you started.
As you can see the past three years have been less glamorous, but based on the median we may be due to for a positive month again. Which admittedly is a contradicting proposition given what we’ve seen in the market over the past few weeks.
That said, recall my general perspective when it comes to timing and trading major corrections: ‘Nothing in the financial markets ever moves in a straight line’.
So it bodes the question: With March being a positive month on average on one side and with the current bull market showing signs of an impending correction, what are the odds of a significant wipeout in the near term future? Are there any prospects of green shoots this month or are we going to see a repeat of 2020?
In order to answer that question let’s look at this week’s and next week’s stats and how they measure up against the rest of the month:
Please log in to your RPQ membership in order to view the rest of this post. Not a member yet? Click here to learn more about how Red Pill Quants can help you advance your trading to the next level.

