What is the first thing you look at on Monday morning before the trading session opens? Most traders attempt to get a ‘feel’ for the market by tracking one or more futures contracts related to equity indices. So most likely we’re talking about the ES, the NQ, or the RTY which is the new CME contract for the Russell 2000. I personally mainly focus on the former two but always keep an eye on the RTY as it sometimes provides early clues of divergence. But before doing any of that my first go-to charts are my weekly statistics. Why is that?
Quite simply because, no matter how turbulent things are, seasonality in the financial markets is a thing just like in real life. There is a underlying reason why mid summer is usually quiet and less directional, while the final weeks of the year are usually highly directional, mainly bullish, but less volatile.
And that underlying reason I speak of is the fact that behind all the statistics, charts, trading algorithms, technical analysis, or what have you there is a huge collective of human beings acting in concert based on the reality that defines their own lives. Which of course are also cyclical and seasonal unless you live smack middle on the equator and every day of the year is exactly the same.
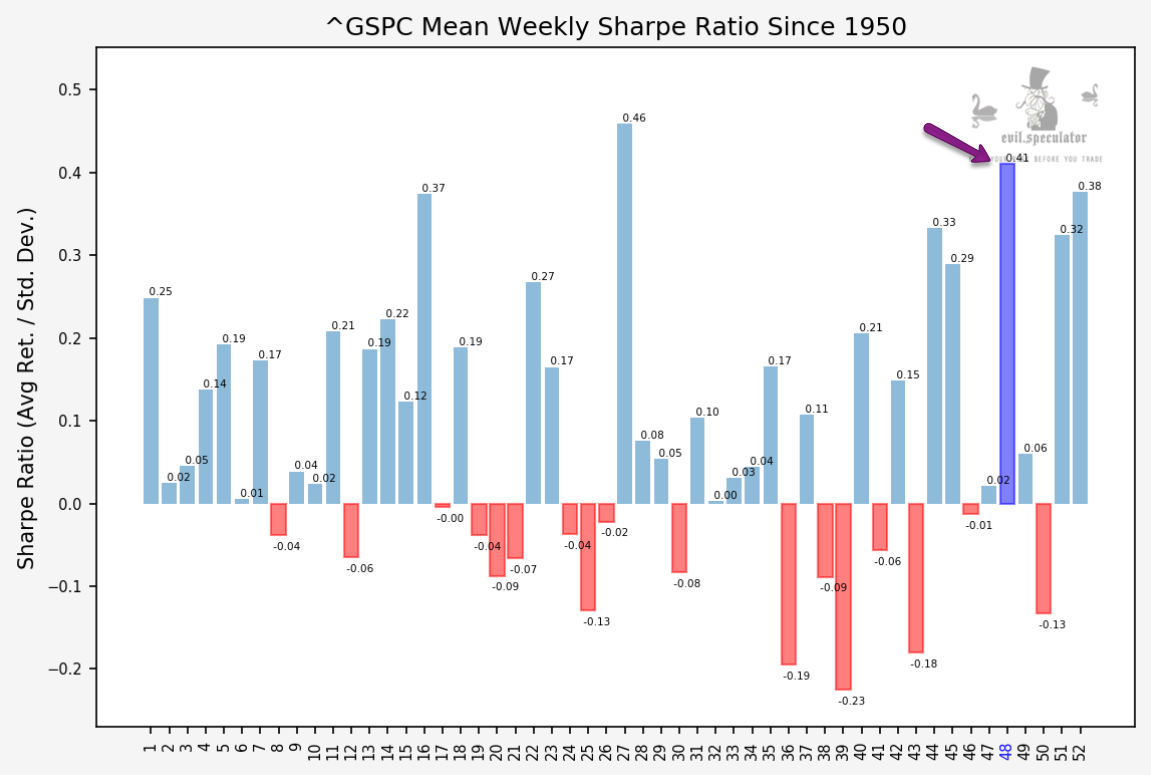
So when I look at the above Sharpe ratio for week #48, do I really expect the SPX to print anything close 0.41 this week? Of course not as statistics is nothing but an attempt of deciphering large datasets by looking for ‘trends’ or a ‘statistical bias’ as I prefer to call it.
If you have a mountain of data that suggests that disco is the bee’s knees but then average that out over the past 70 years then you may jump to false conclusions. Meaning there are cycles within trends and one should be cautious about interpreting them. Of course it also depends on HOW you interpret them.
For example a much better interpretation would be that dance music was extremely popular in the 1970s and still is today. Just like in The Hitchhiker’s Guide to the Galaxy, what really matters sometimes isn’t the answer but the question.
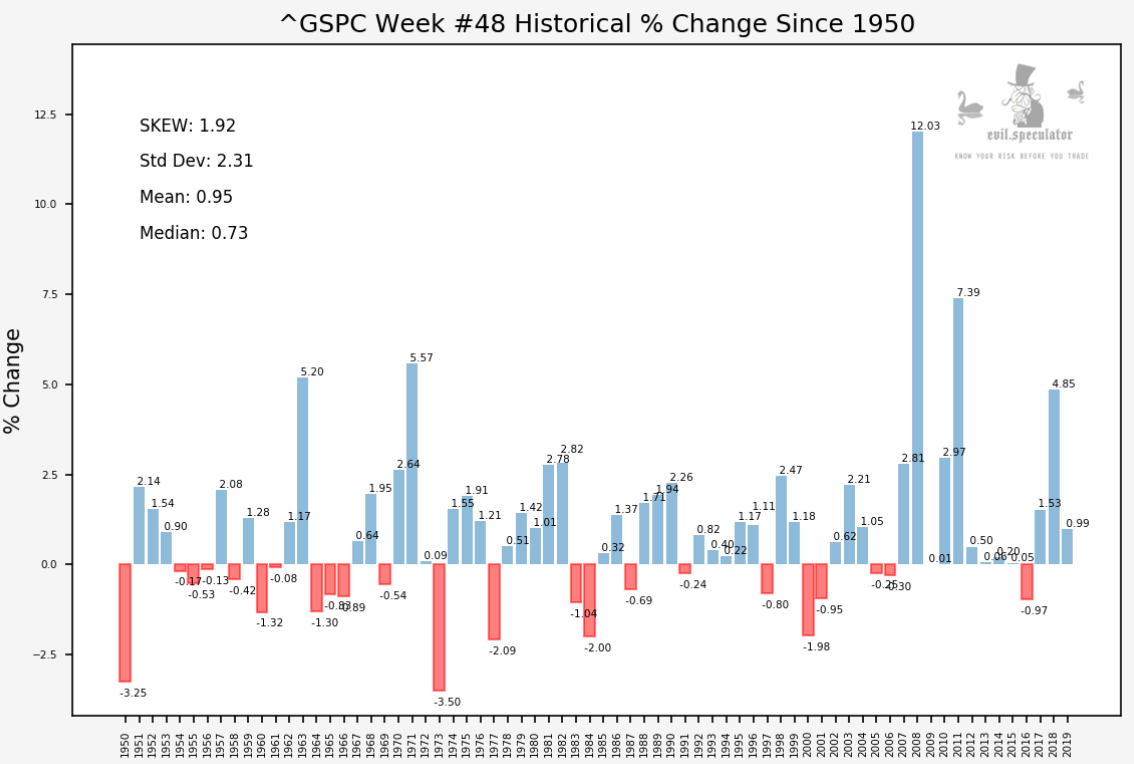
And to be honest that’s often a bit of an iterative task. What I mean by that is that I often ask different questions based on what I am already seeing in the data. Take the historical % change graph above which shows us fairly convincingly that, on average, week #48 is a very good one for the stock market.
Standard deviation is a bit elevated but mostly due to large swings to the upside. And that right there can provide me with very valuable clues as to what type of trading activity may be most conducive to surviving the week, and perhaps even profiting a little.
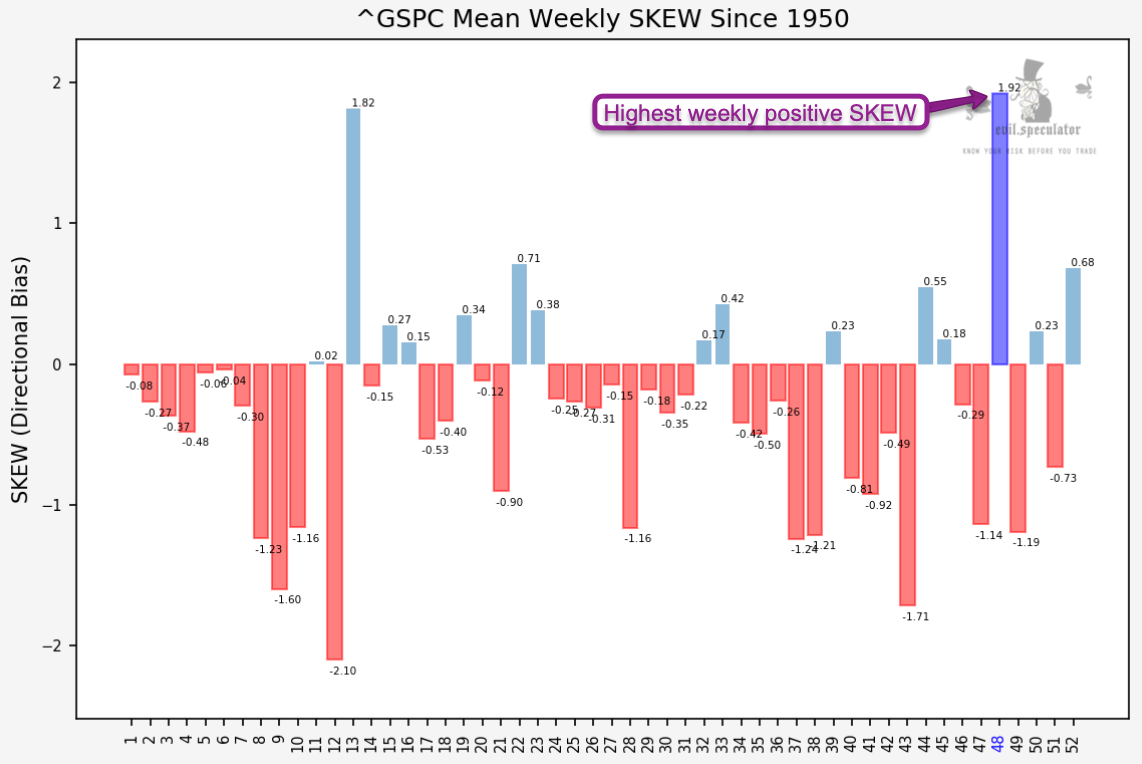
Now in finance a positive SKEW is often interpreted as a bad thing as the bulk of the dataset is concentrated on the left side (with profit distribution spanning left to right). It’s something that confused me as well when I started diving into statistics but nothing could be further from the truth.
Let me show you why that is a common misconception, why this week is in fact considered ‘the big mover of the year’, and most importantly, how to take advantage trading it in the real world:
Please log in to your RPQ membership in order to view the rest of this post. Not a member yet? Click here to learn more about how Red Pill Quants can help you advance your trading to the next level.