If I could have a penny for every setup I felt enthusiastic about and that invariably blew up in my face I would be… well, a lot richer than I am. To be honest when it comes to picking juicy entries off a chart I rank about average. What may set me apart from the rest, and what has helped me survive in a wide range of market conditions over the years was learning to overcome my instincts and engage in setups that scared the heck out of me.

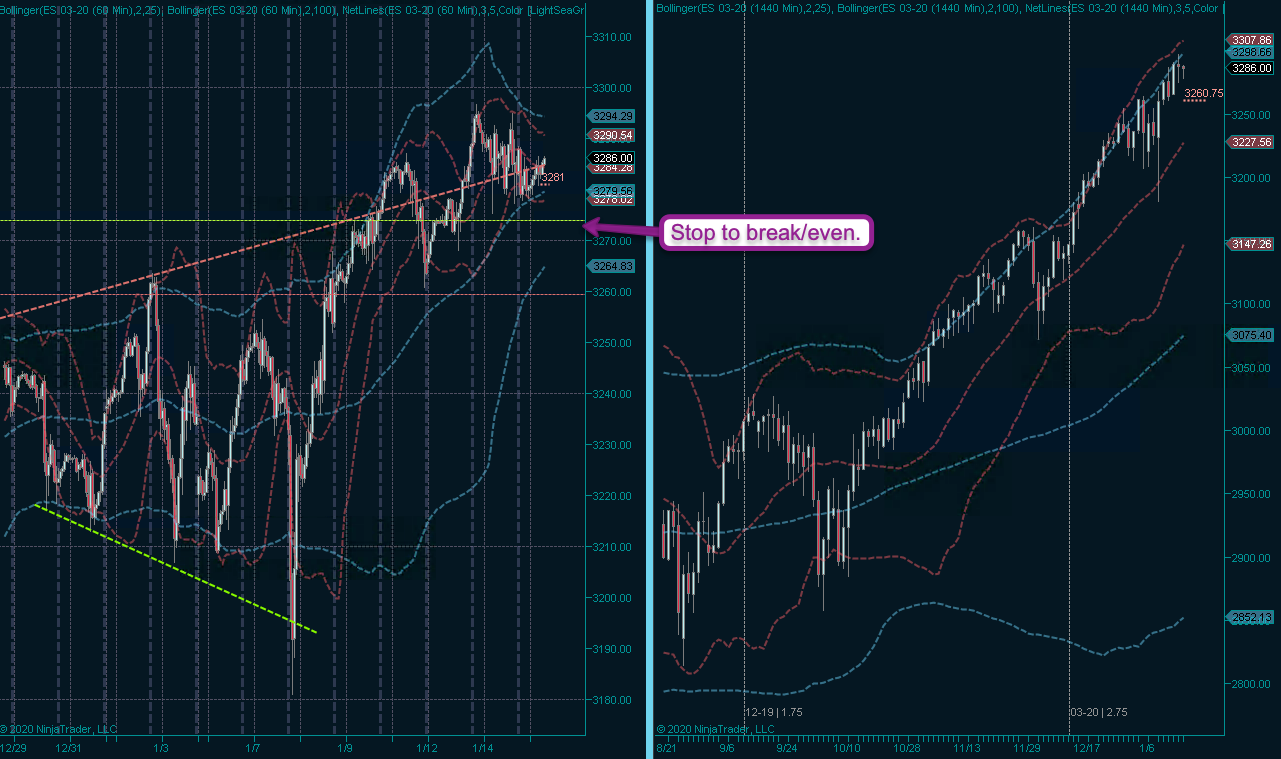
A great example was Monday’s long entry in the E-Mini at a moment in time equities looked like they were about roll over and nose dive in a spectacular fashion. As you may recall my initial instinct was to run for the hills but I did the exact opposite and took out a long position.
Now don’t get me wrong, although my stop is now at break even after the campaign having touched 1R, we are far from being out of the woods as this could easily turn out to have been ahead fake. However it goes to show how one’s instincts can be fooled by falling for the age old trap of mean-reversion.
Not that mean reversion doesn’t exit. It does – even for random walk paragons like financial price series. The problem that kills most retail rats is that they are usually mistaken about a) the timing of the reversion and b) the mean itself.
Look at the chart above and tell me where you would pin the mean. Well, first of all it depends on how far you’ll go back. You can’t really rely on a mean by looking at ten days of price action, even on an hourly chart.
So let’s visit the daily then on the right. First question that comes to mind then is this: No matter where you pin the mean – shouldn’t this bastard have mean reverted already sometime back in mid October?
Yes it should have but financial price series don’t really roll like this. Remember that raw price is not a reliable measure for statistics so you would have to use log or percent returns. And then you still would have to wait for extremes in the signal before the odds of mean reversion offer you a decent edge.
So if we can’t rely on mean reversion without running complex stats (most of you guys are too lazy to do – ahem) then what can we rely on when parsing for entry candidates?
I for one look at realized (historical) volatility for clues – especially if it follows a period of HV price action. Here’s the E-Mini again on an hourly panel and as you can see the first few trading sessions of the year pushed sideways with RV expanding, which in the end culminated in a stop sweep that scared the bajeebies out of everyone.
That is where we came in and thus far at least fading crowd sentiment seems to be paying off.
Here’s gold – another long candidate I may consider in the near future. The recent trend has been to the upside and what I like in particular was the expansion in RV which was followed by a mighty take down that got me stopped out at 8R in juicy profits.
Now watch how RV has been subsiding gradually is currently scraping the bottom of the barrel. Price action is already creeping to the upside, so is this a good long entry candidate?
It would be except that the Yen isn’t cooperating at the current time. Should it start catching up with gold then I may consider a long entry but until then it’s best to abstain.
Please log in to your RPQ membership in order to view the rest of this post. Not a member yet? Click here to learn more about how Red Pill Quants can help you advance your trading to the next level.


