For 2021 won’t be a year for the faint of heart. If you’re happy that 2020 is squarely in your rear mirror, then keep in mind that despite all the political and social chaos you may have endured we at least enjoyed a roaring stock market. When was the last time you witnessed a whopping 42% rally in the SPX – or any other sector – in the course of only 9 months? Okay, except for BTC perhaps 😉
But that’s all behind us now. The best way to summarize where we are heading next is this exotic graph of the Spiders which depicts what’s commonly called the ‘options smile’.
It’s a great way of expressing the implied volatility of each series across the entire option chain as it tells you in one simple graph the amount of downside risk ‘the market’ perceives to be present for each particular expiration (one line per).
And even if you’re not a seasoned options trader is easy to see that put strikes shown on the left side of the chart are currently ‘risked’ and thus priced with a substantial premium in comparison to call strikes on the right side of the chart.
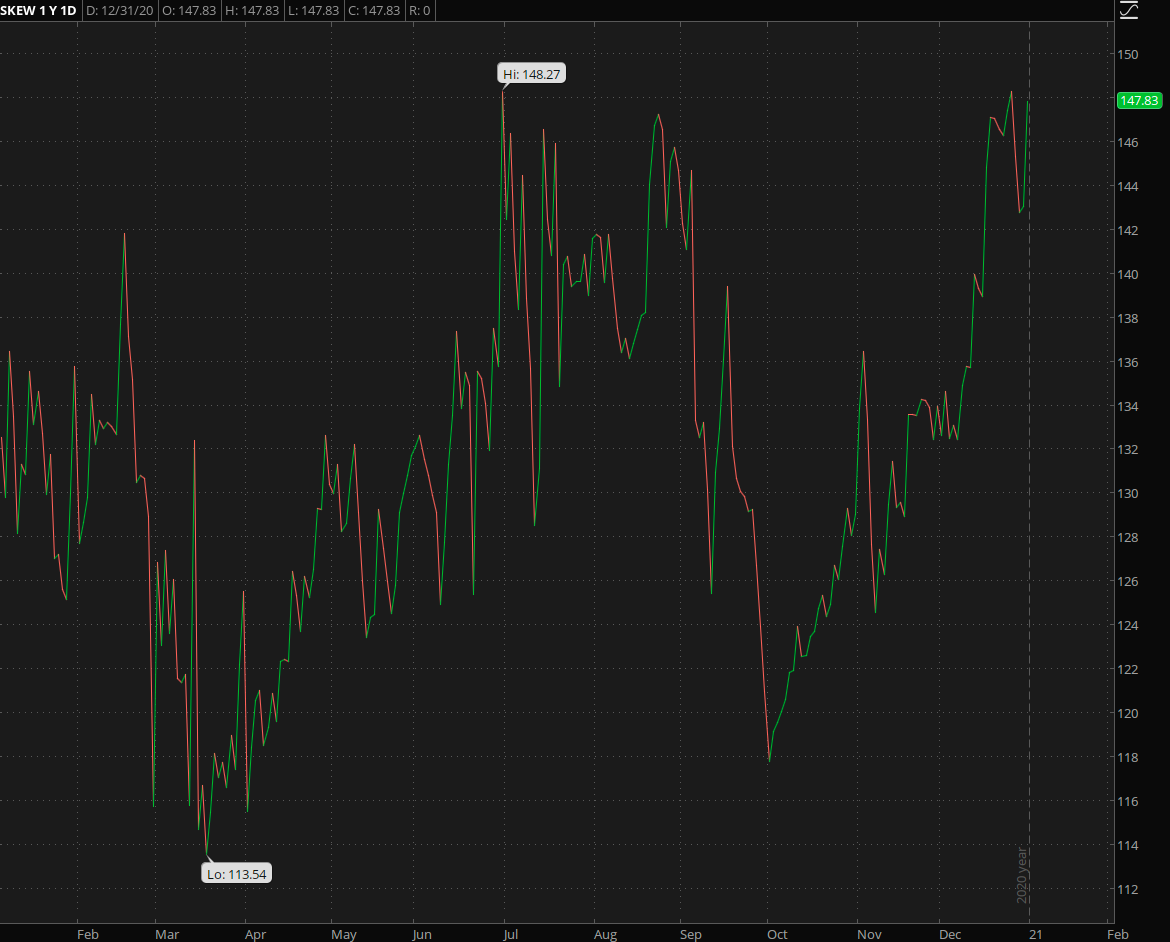
Let’s put things a bit more into historical context. Here’s SKEW shown as a line graph and how it progressed over time. After all the current reading could be considered normal to the untrained observer.
Clearly it is not – in fact it is right up there in the market’s stratosphere.
And yes, you are right in thinking that the perception of risk does not necessitate a market crash or at least a meaningful market correction. That said, when you start seeing an increase in warning signals across several verticals then it’s time to pay attention.
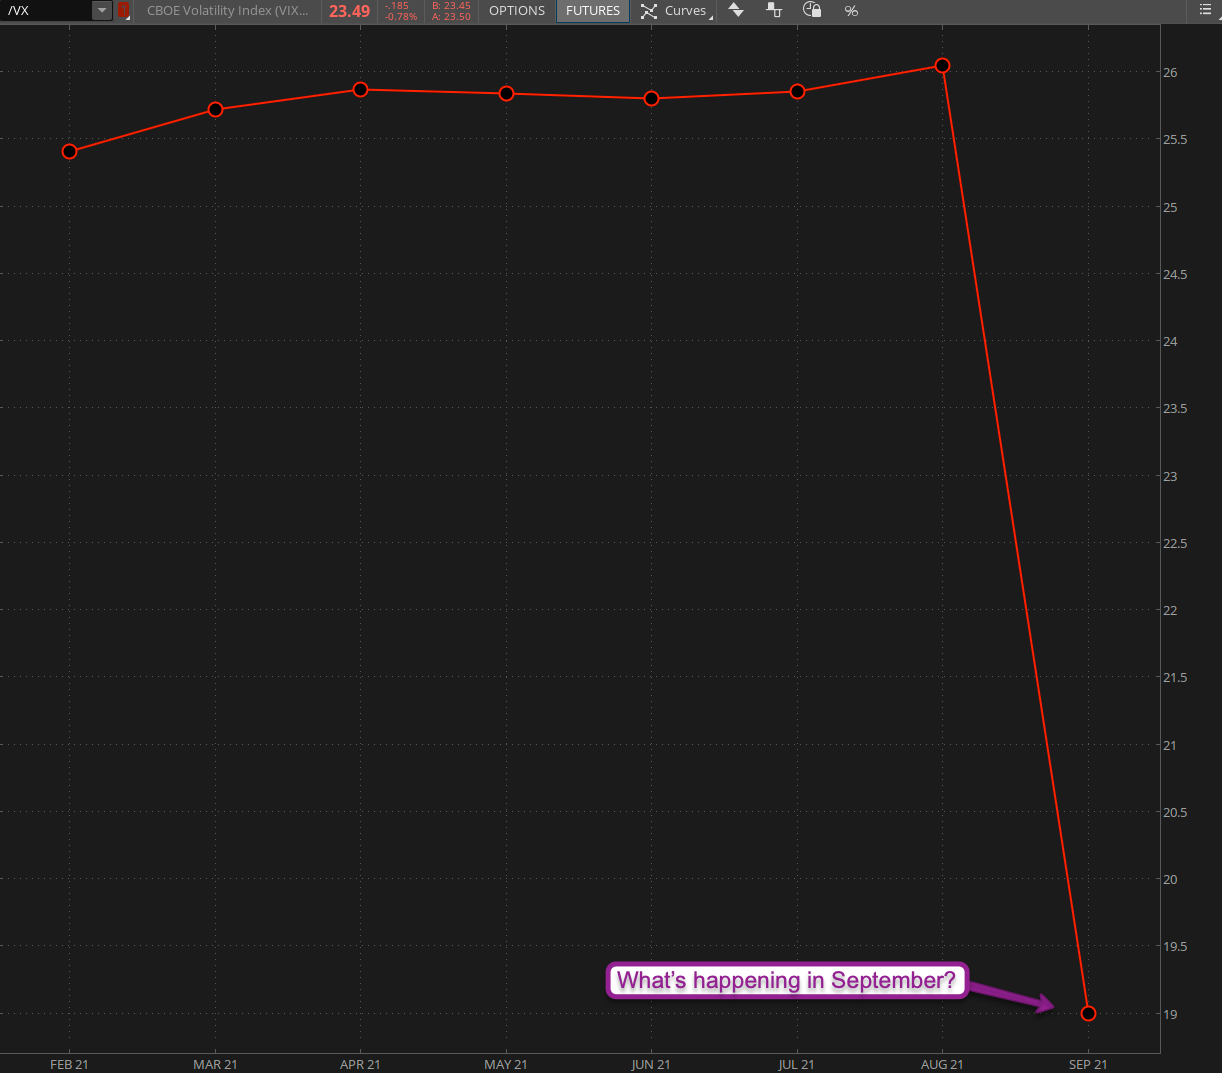
Another one I have continued to highlight are the VX futures which remain consistently elevated all the way into summer. And no, I have not yet figured out why September seems to be ‘all in the clear’.
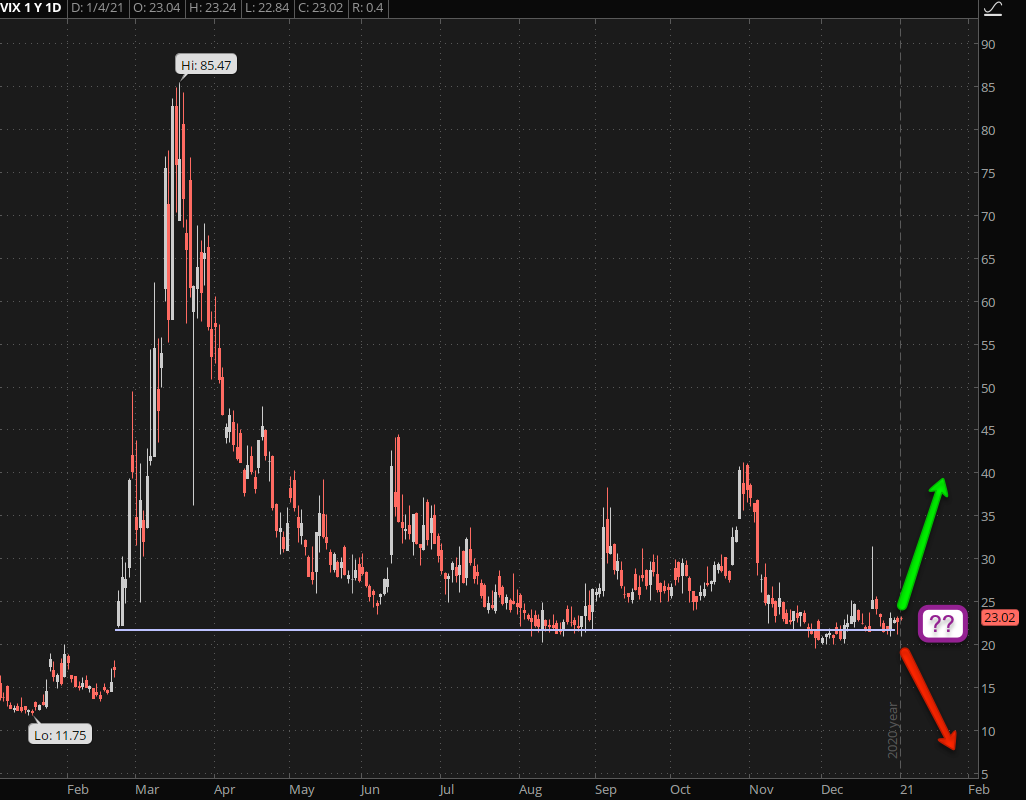
Again, you may be thinking: “Mole, what are you smoking? The VIX has been treading water for the past three months.”
You would be half right – for one I don’t smoke, but I have studied implied volatility extensively and let me ask you this: Here we have a VIX painting ‘lows’ at around 23 after a 42% rally within 9 months. Does this seem normal to you?
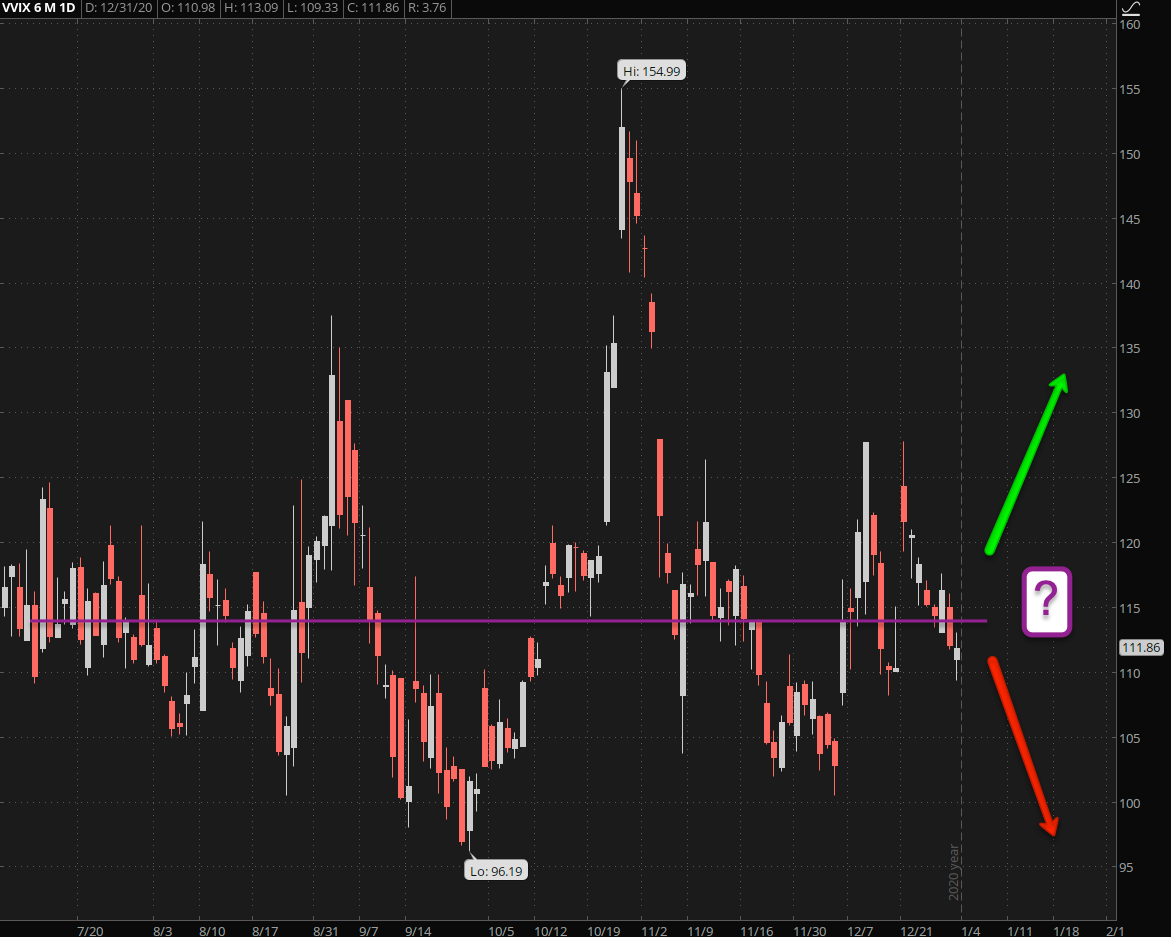
Also let’s not forget that realized volatility within the VIX has consistently remained above the 100 mark (yes that’s high) all through that face ripping rally and our current 6-month median sits at around 115.
Just like face diapers it appears that fear of the future and volatility has become part of the ‘new normal’.
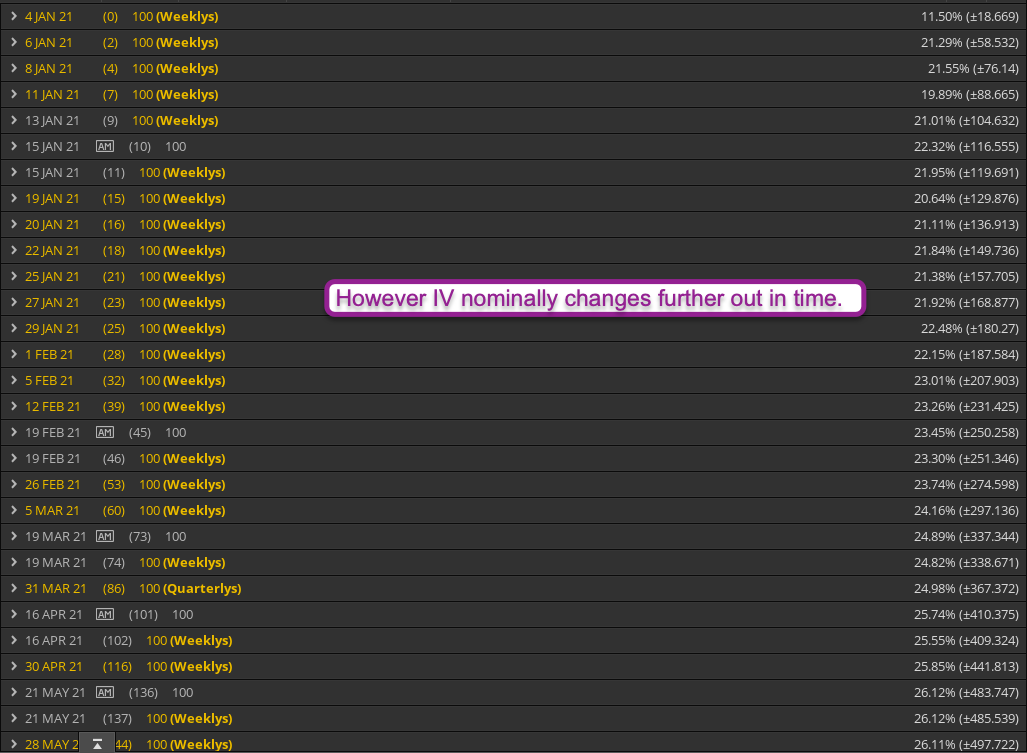
Consider this SPX options chain in the context of the VX futures product depth chart (the 2nd chart from the top). Despite massive price mismatching between OTM put and call options near term implied volatility barely moves as we push further out in time.
What all this combined tells me is this as we push into the first trading session of 2021:
- We are trading near all time highs.
- Downside protection is commanding a massive premium.
- IV remains elevated not just in the short term but all the way into the summer.
- The VIX remains elevated but is low in the context of the past year.
All this spells massive opportunity to me. The iron is hot and now it’s time to wield it.
Let me show you the HOW and the WHERE:
Please log in to your RPQ membership in order to view the rest of this post. Not a member yet? Click here to learn more about how Red Pill Quants can help you advance your trading to the next level.


