October is behind us and despite being infested with termites and cockroaches the house still appears to be standing. Historically speaking we ought to now be heading straight into the most productive earnings season of the year. Of course 2021 – like its preceding year – has not been a regular year. Nevertheless the stats are the stats, so let’s get on with it:
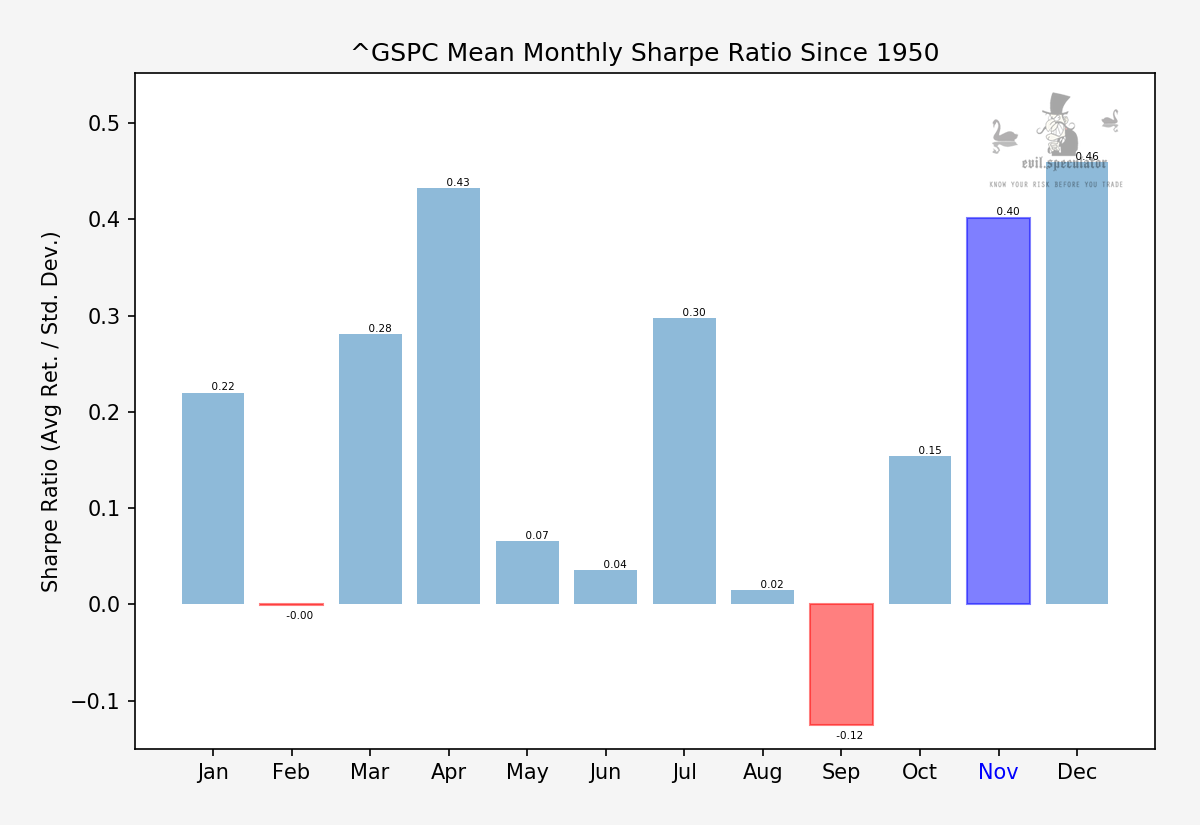
As you can see November has been a solid earner since our stats began in 1950.
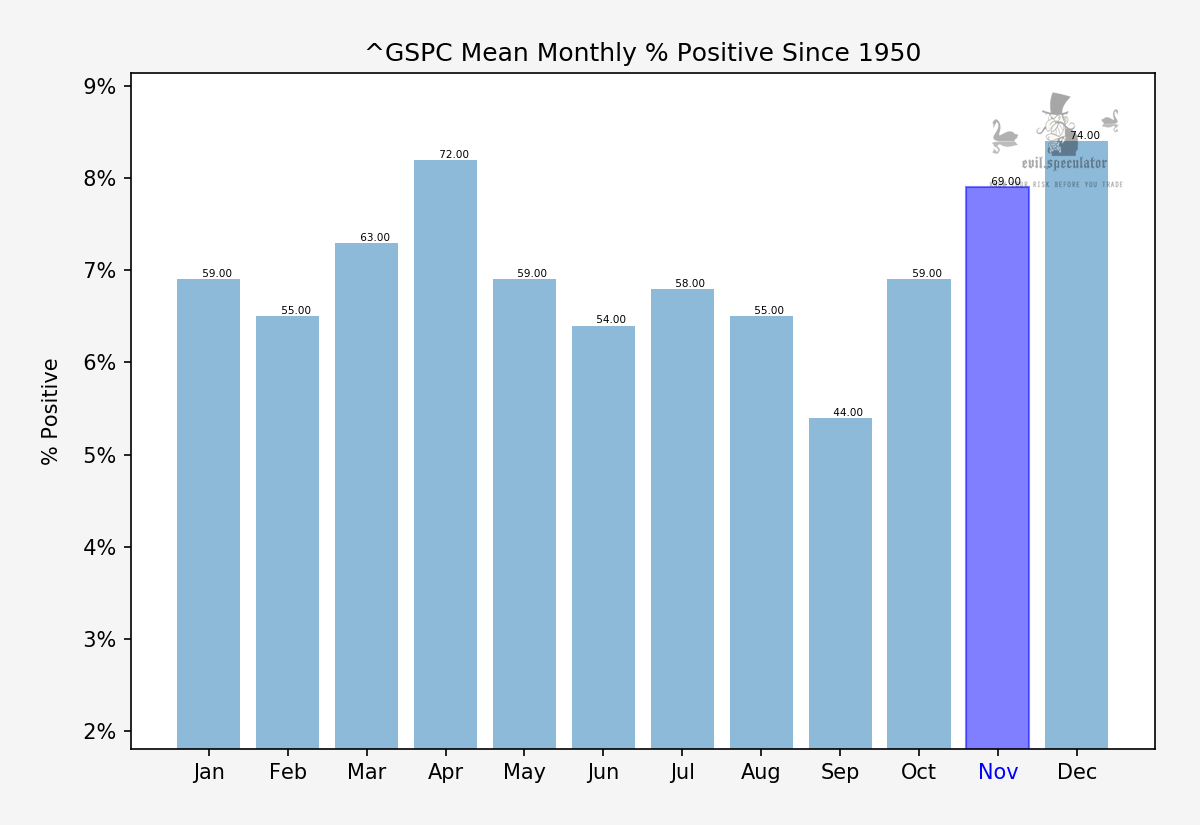
Mean monthly percent positive stands at a whopping 69% – only to be outdone by April and December.
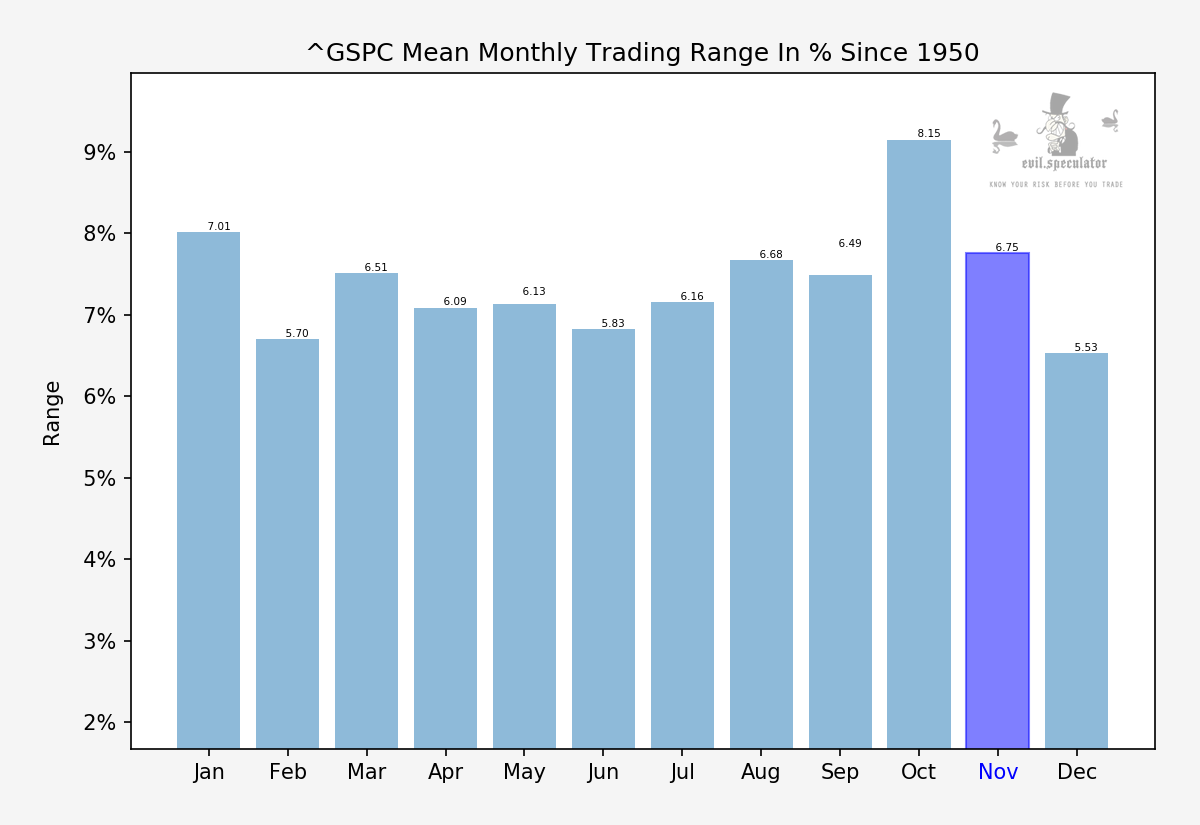
Unlike October the trading range is elevated but not too far off the median.
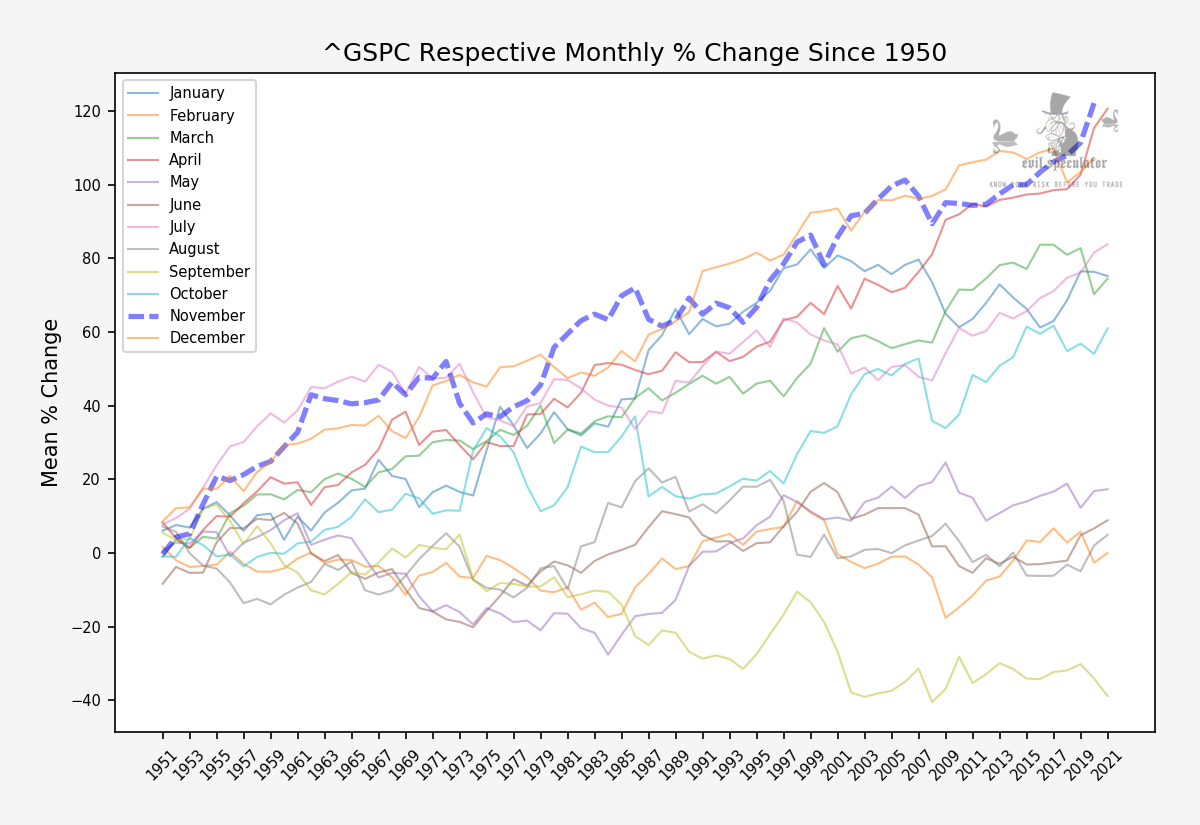
I love this chart – basically it shows us the performance of a system that would have bought on 11/1 and sold on 11/30 for the past 70 years. Clearly there’s a solid edge here – over the long term of course.
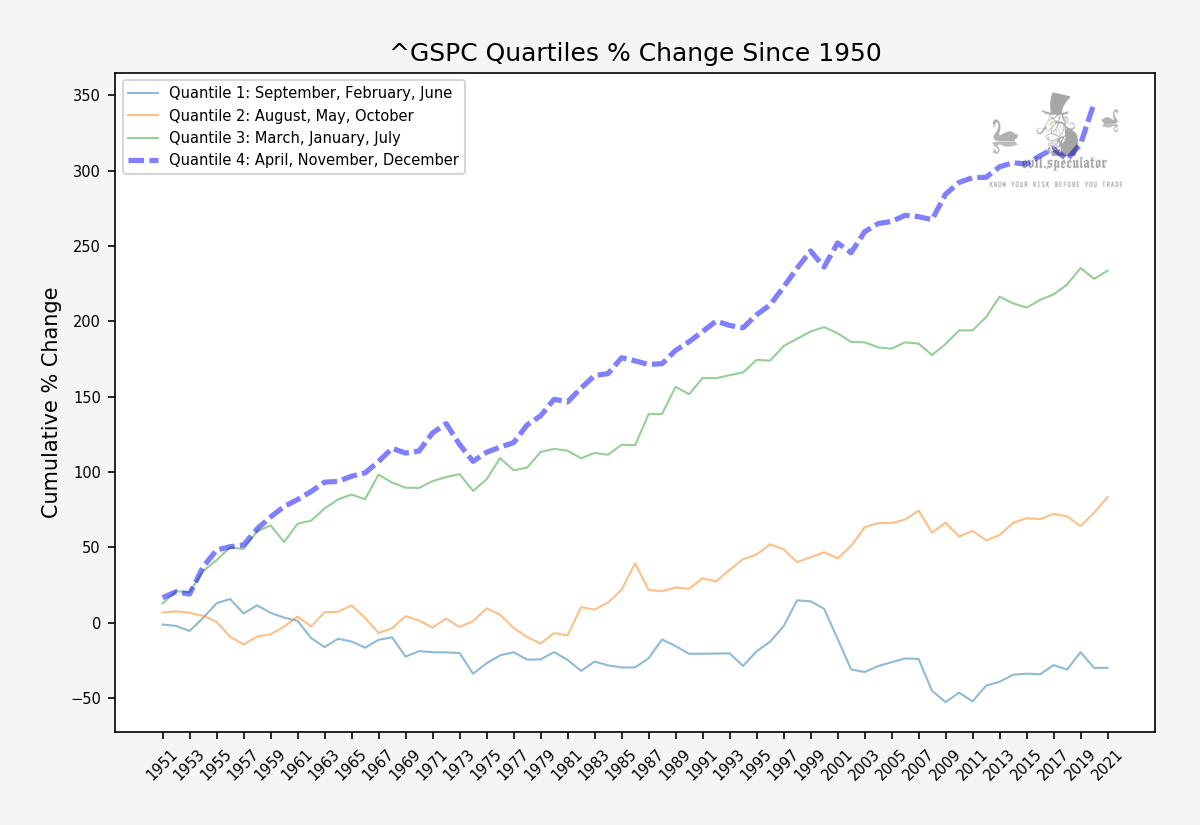
Can’t wait 70 years to cash out? Understandable, but taken together with April and December this simple strategy has the potential for very respectable gains over the course of one’s trading career. Something to consider if you’re still in your 20s, 30s, and perhaps even 40s. For old farts like me the long con is of course not an option.
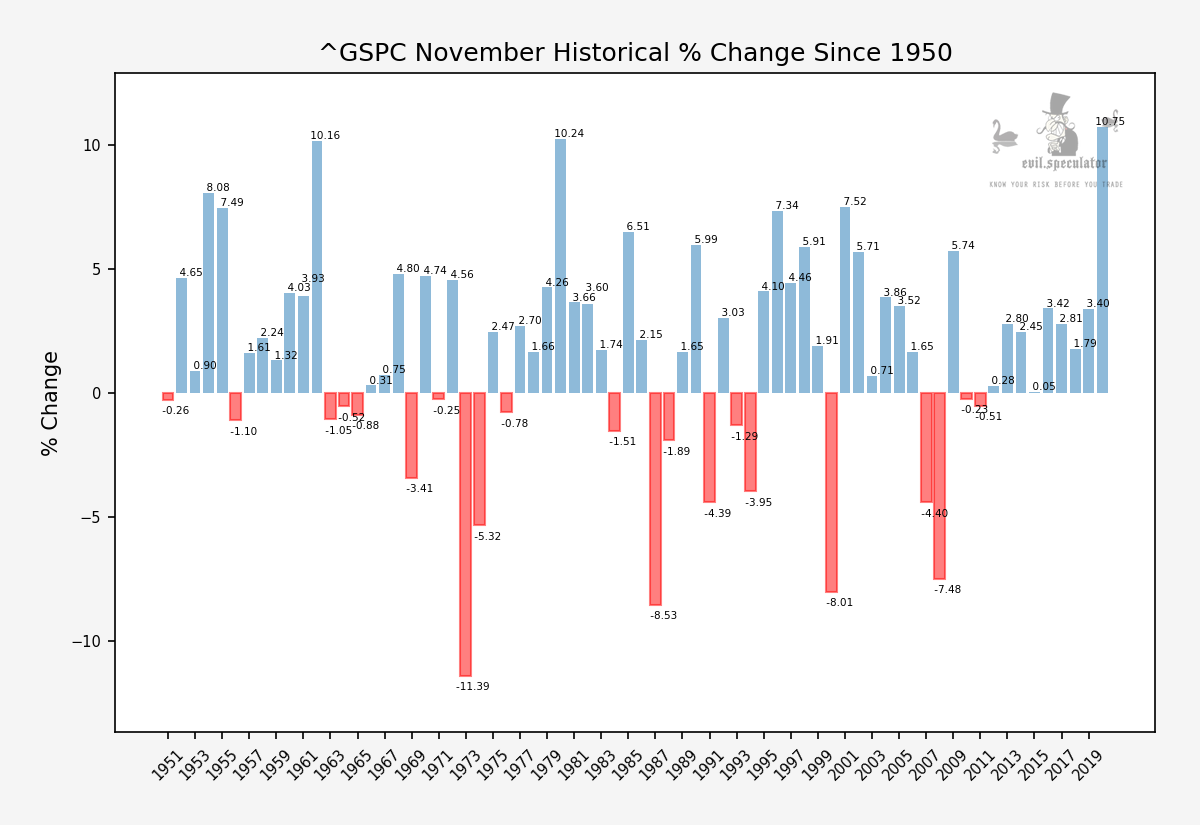
Now here’s the full November data set. There are a few bad offenders in there but as a whole the winners far outweigh the losers.
Okay now let’s talk week #44 – which has a few surprises up its sleeve:
Please log in to your RPQ membership in order to view the rest of this post. Not a member yet? Click here to learn more about how Red Pill Quants can help you advance your trading to the next level.