I’m pretty ecstatic this morning! And although the prospect of a looming EOY holiday week may play some part, the main reason for my emotional exuberance is that I’m putting the finishing touches on a project that combined has taken me nearly 2 years to bring to fruition. It’s been a monster effort that launched in early 2018 has cost me literally 5000+ man-hours of hard work to get to this point.
Whether or not it will pay off in the end remains to be seen – only the future will tell. But if nothing else a major positive aspect moving forward is that I will once again have a lot more time to purely devote to trading, technical analysis, and market research. Which means more posts, more charts, more campaigns, more politically incorrect humor, and happy subscribers! 😉
Alright let’s dive right in – here we are at the cusp of the last trading ‘week’ of the year. It’s not really a full week though as the NYSE only opens for half a session tomorrow and is closed on Wednesday.
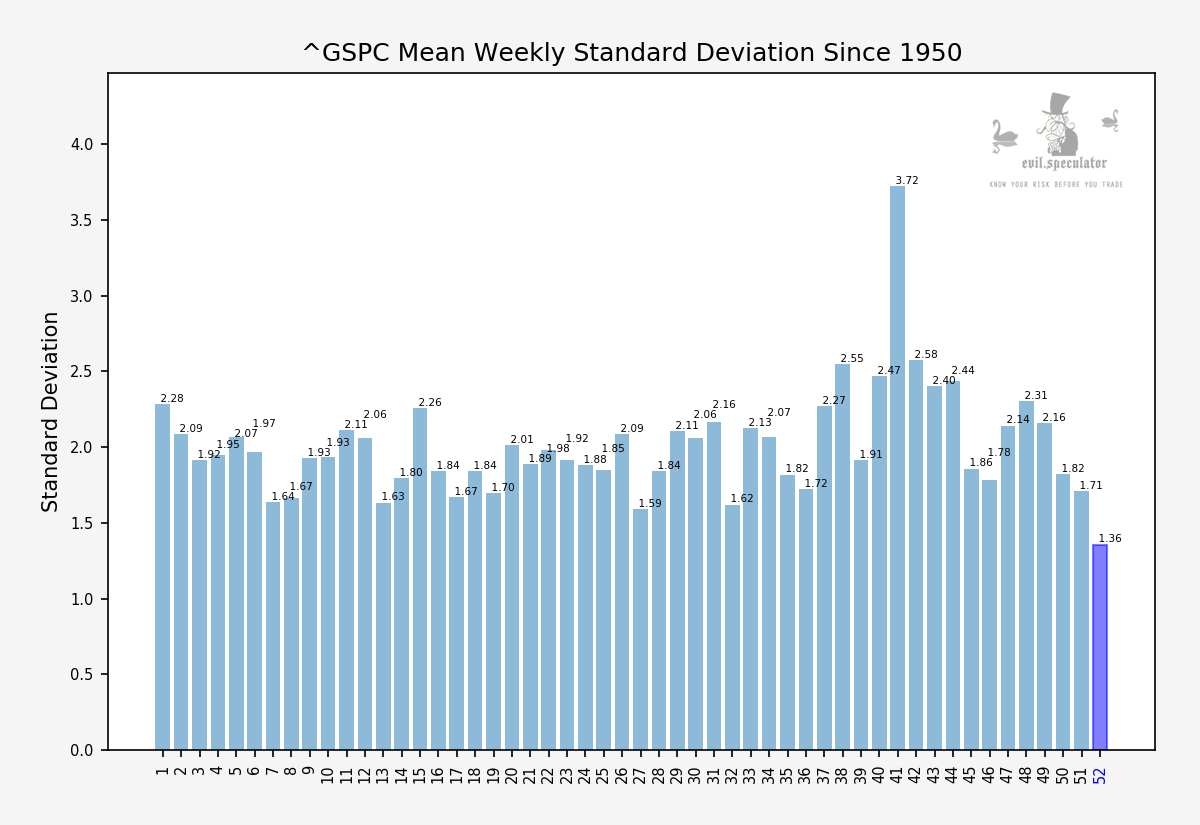
Thursday and Friday are officially open but as you can see on the standard deviation chart above we usually don’t see a lot of movement during the holidays.
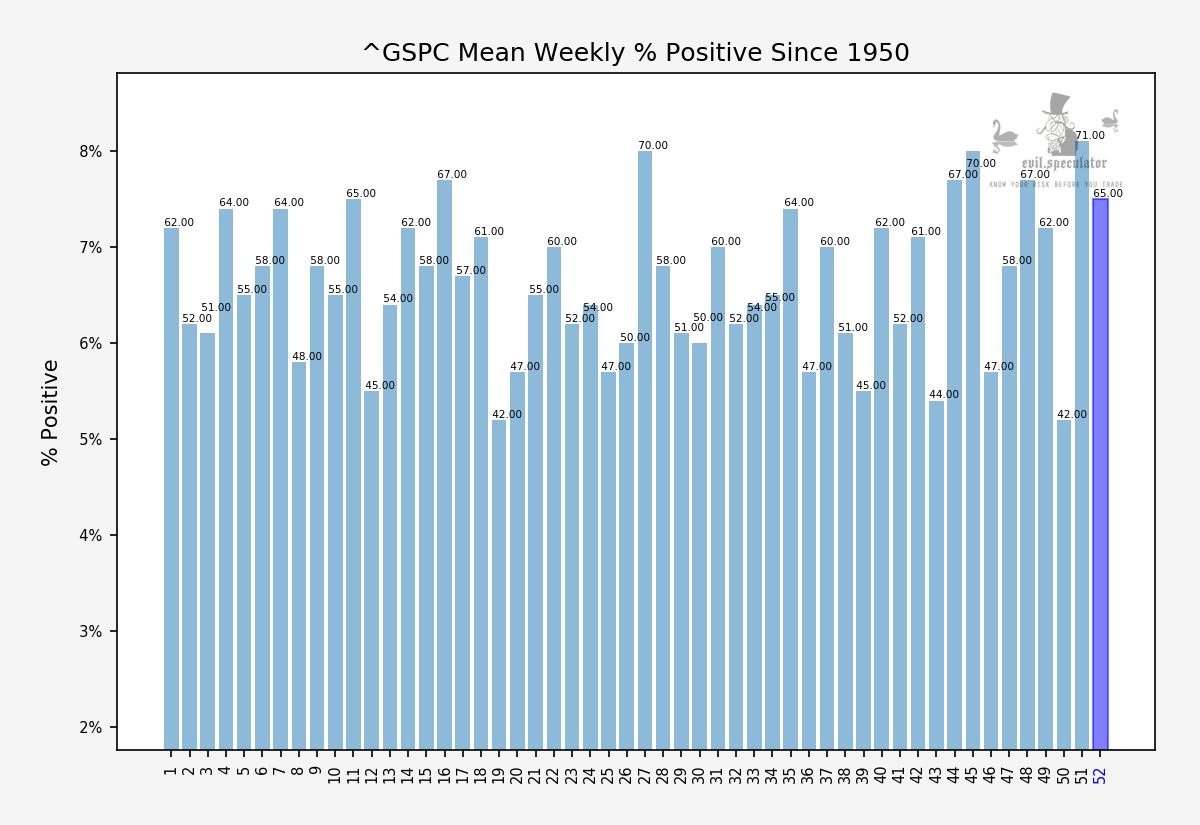
The upshot is that the odds are well in favor of a bullish close in the little session time we do get this week – since 1950 the SPX has closed in the plus 65% of the time in week #52.
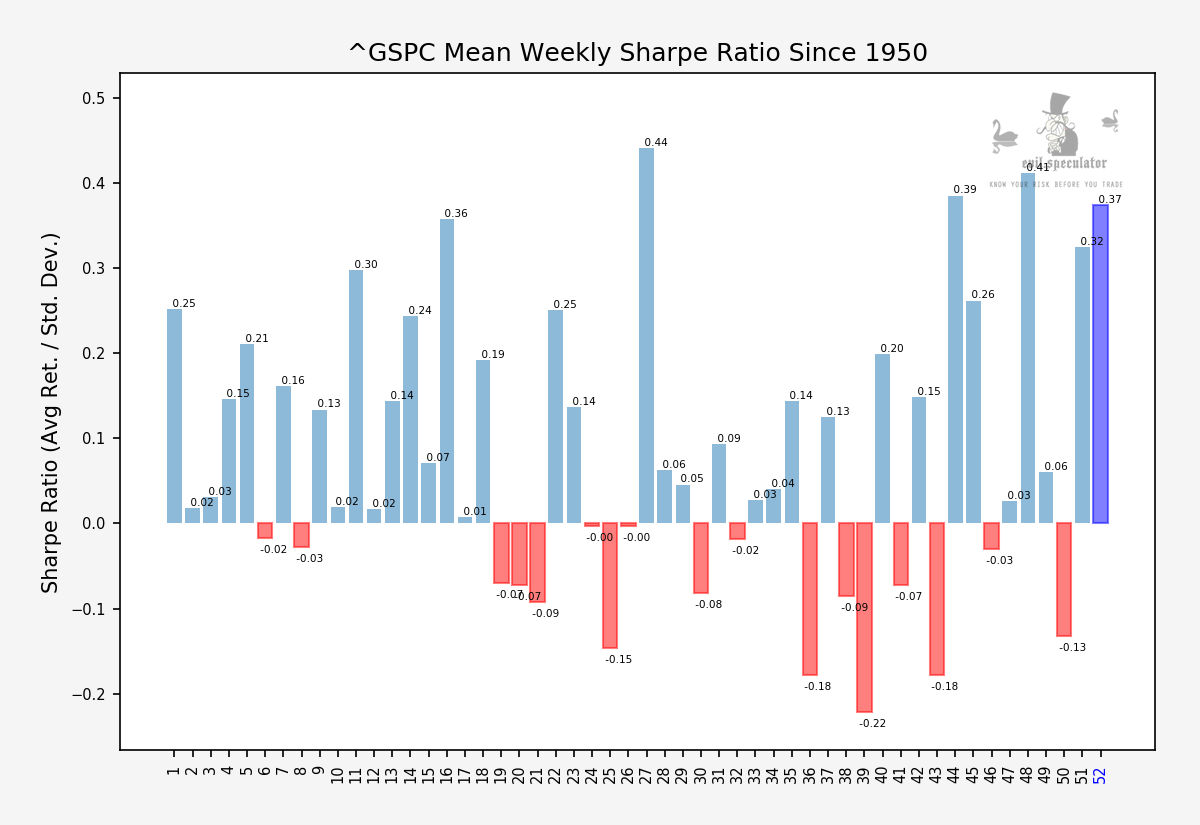
Which is why a Sharpe ratio of 0.37 isn’t overly surprising – what is that it’s the fourth most bullish week of the year, despite it being a very short one. But who really would be complaining about that?
Wouldn’t it be nice to show up for work 3 days per week and pull a little profit each time? One can dream…
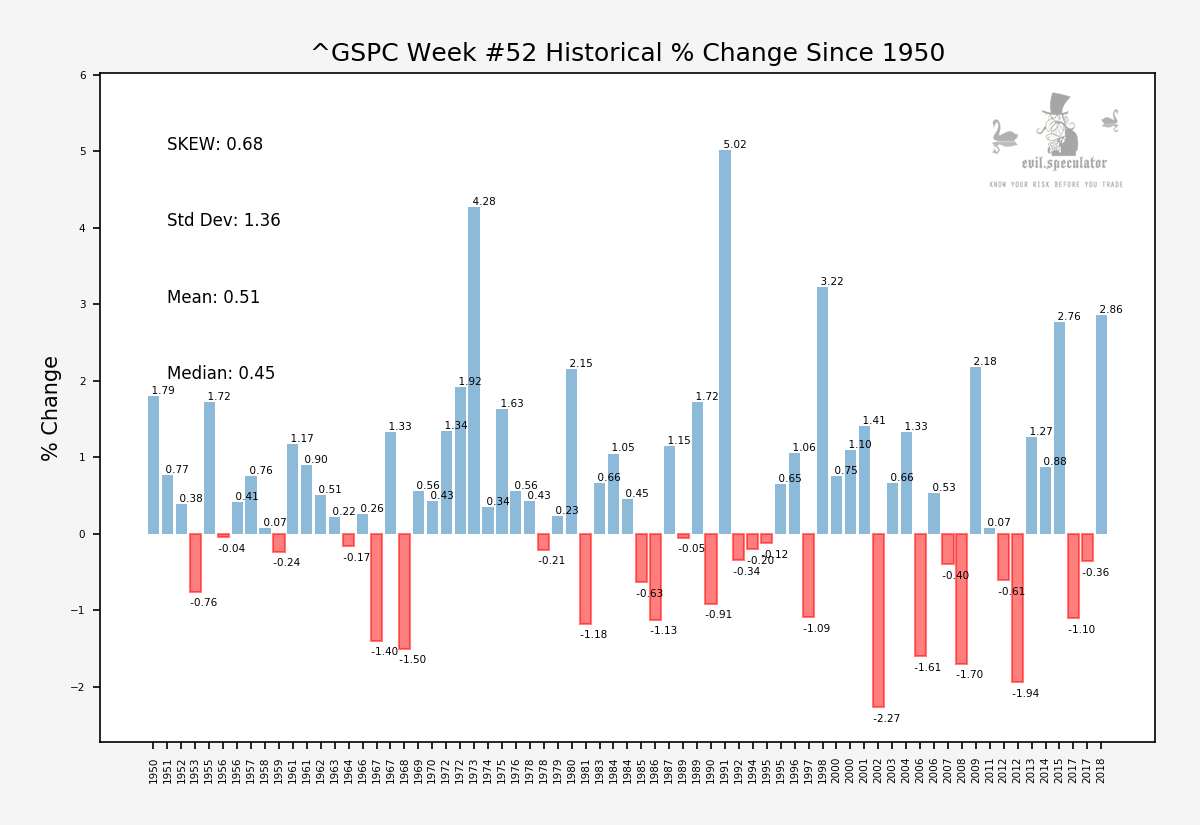
Here’s a bit more context for you statistics nerds. It’s worth noting that the incidences of negative weeks seem to be increasing since the 1980s. There was a period of consecutive positive closes until the dotcom bubble burst in 2000 and since then it’s been about a 2:1 alternation.
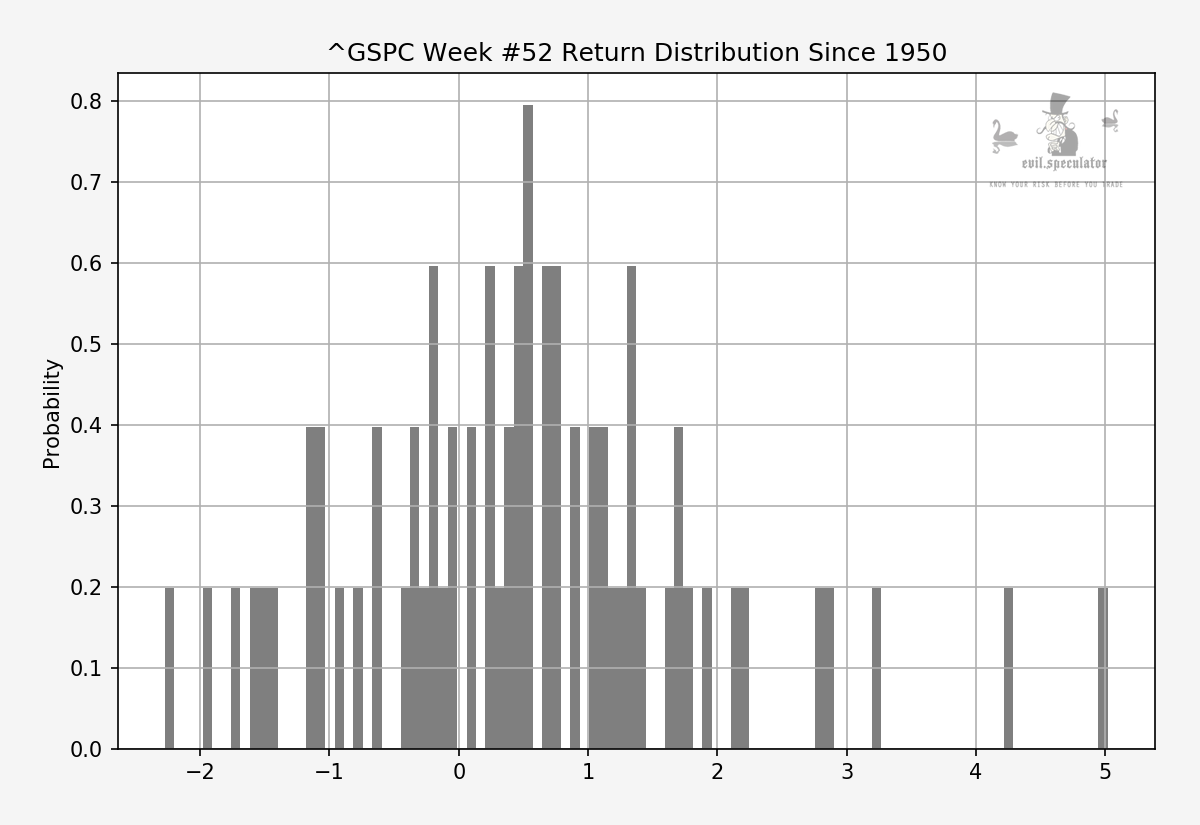
If you paid attention to the previous chart then you may have noticed that the mean was actually larger than the median, which gives week #52 a positive SKEW. This does not necessarily speak to the center of the distribution but its shape in that it is long tailed on the plus side.

Now for my intrepid subs I’ve got a bit of special IV intel I’ve been digging up. Plus of course we have our top and bottom performing stock victims for week #51:
Please log in to your RPQ membership in order to view the rest of this post. Not a member yet? Click here to learn more about how Red Pill Quants can help you advance your trading to the next level.
