I looked at the VX futures term structure this morning, i.e. the series of VX futures contracts from now into late this year, and something occurred to me. For over six months now I have been plotting various changes in this curve in exhausting detail and the story it’s been telling us has remained largely identical. Big trouble ahead! So how come the market continues to push higher and higher with the SPX officially marking new all time highs as well as reaching the coveted $4,000 mark?
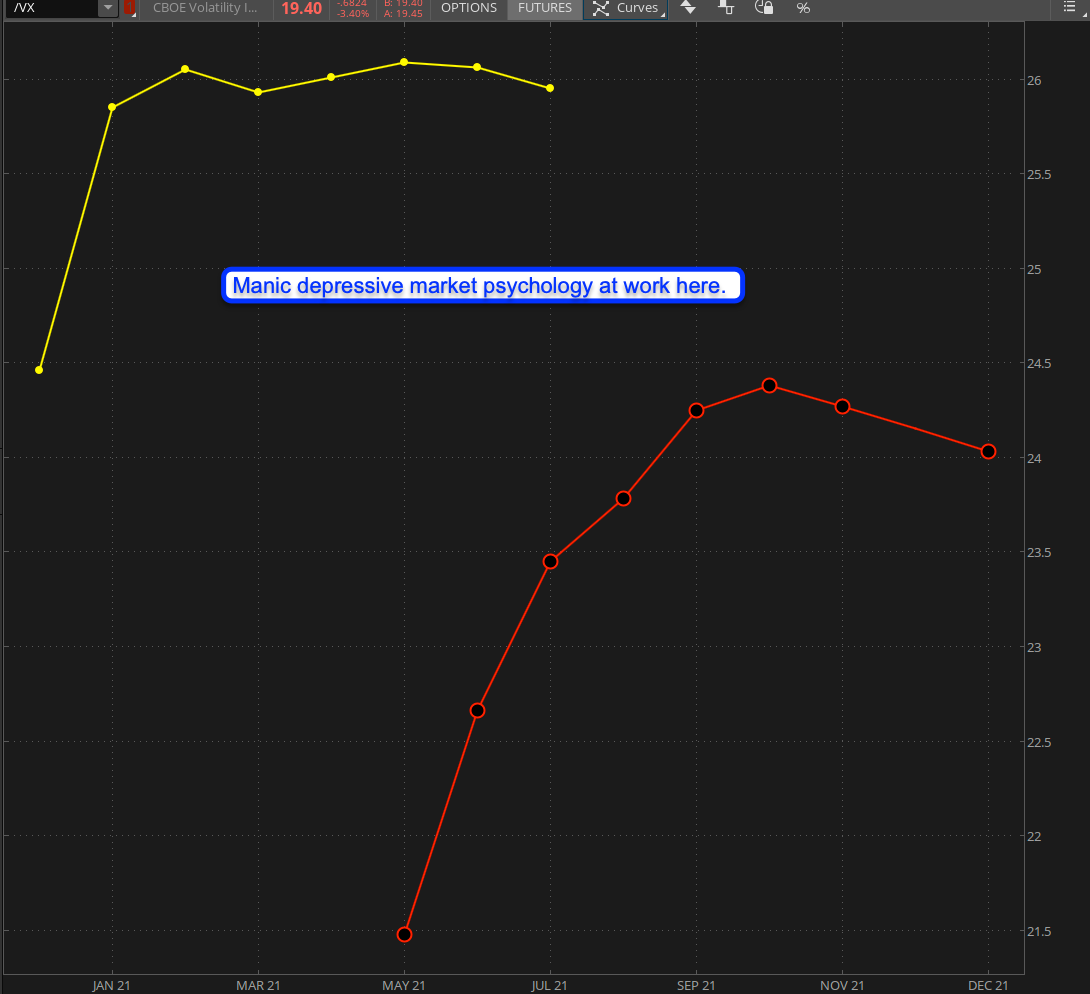
The graph above shows us two curves – a yellow one and a red one. The yellow curve basically represents a window into the past while he red curve shows us what’s going on right now. What immediately stands out is that the market appears to need to book some time with a good shrink as the anticipation of ‘trouble ahead’ appears to have become a constant.
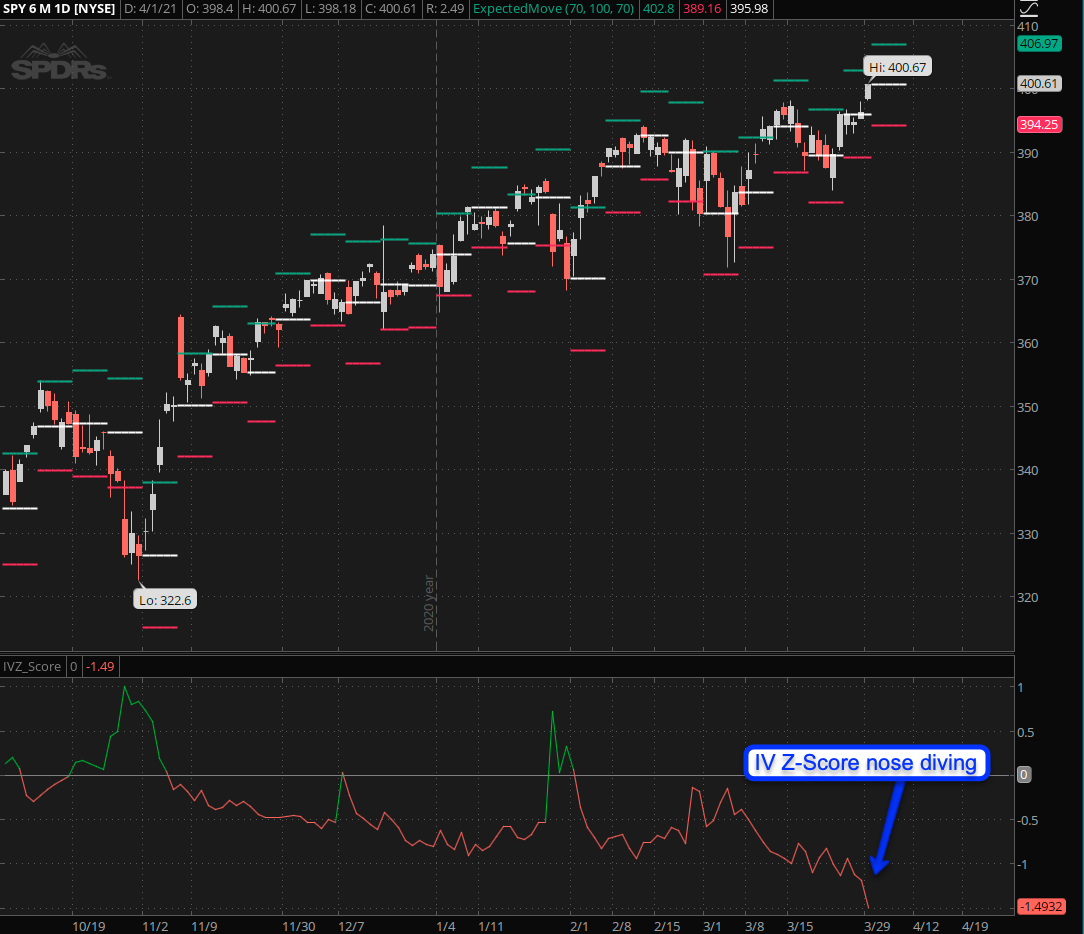
But what we’ve been getting instead is something completely different of course. A very clean series of higher highs and higher lows in fact. The IV Z-Score has dropped into the basement and we may need to bring out some excavation equipment to get it back.
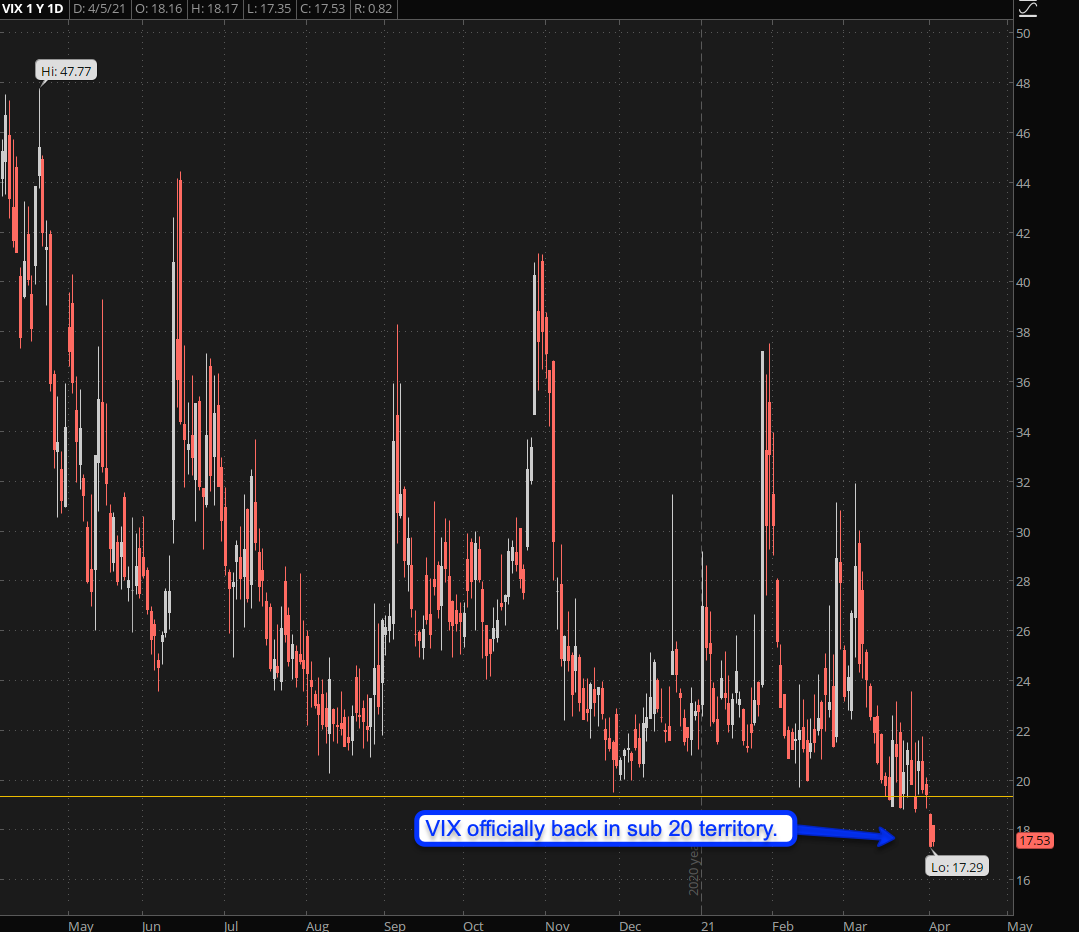
The VIX is now officially back in sub-20 territory which on one hand is very exciting as we may be able to start loading up on some medium to long term hammock spreads.
But not so fast! There are some important developments we need to be cognizant about:
Please log in to your RPQ membership in order to view the rest of this post. Not a member yet? Click here to learn more about how Red Pill Quants can help you advance your trading to the next level.