Recently I’ve talked a lot about implied volatility, mean reversion, linear regression, and other exotic topics. But there comes the time when you simply need to take a step back, clear your mind, and just look at the situation from a very straight-forward and practical perspective. So let’s channel our inner Steve Jobs (yup fan boy here – bite me) and look at some basic price charts:
In my Price Action Masterclass I covered price gaps and especially opening gaps extensively. The first thing we need to ask ourselves is what opening gaps represent and why we should care about them at all.
You don’t see any type of gaps in the futures or forex very often, and if there any they are relatively small. Reason being of course that the futures and forex markets trade 24×7 (so does crypto) while indices and ETFs only register during NYSE trading hours.
With that in mind it becomes clear that wide price jumps in between sessions tell us that investor sentiment does not pause at the bell and that a lot can happen in the 16 1/2 hours and weekends separating one session from the next.
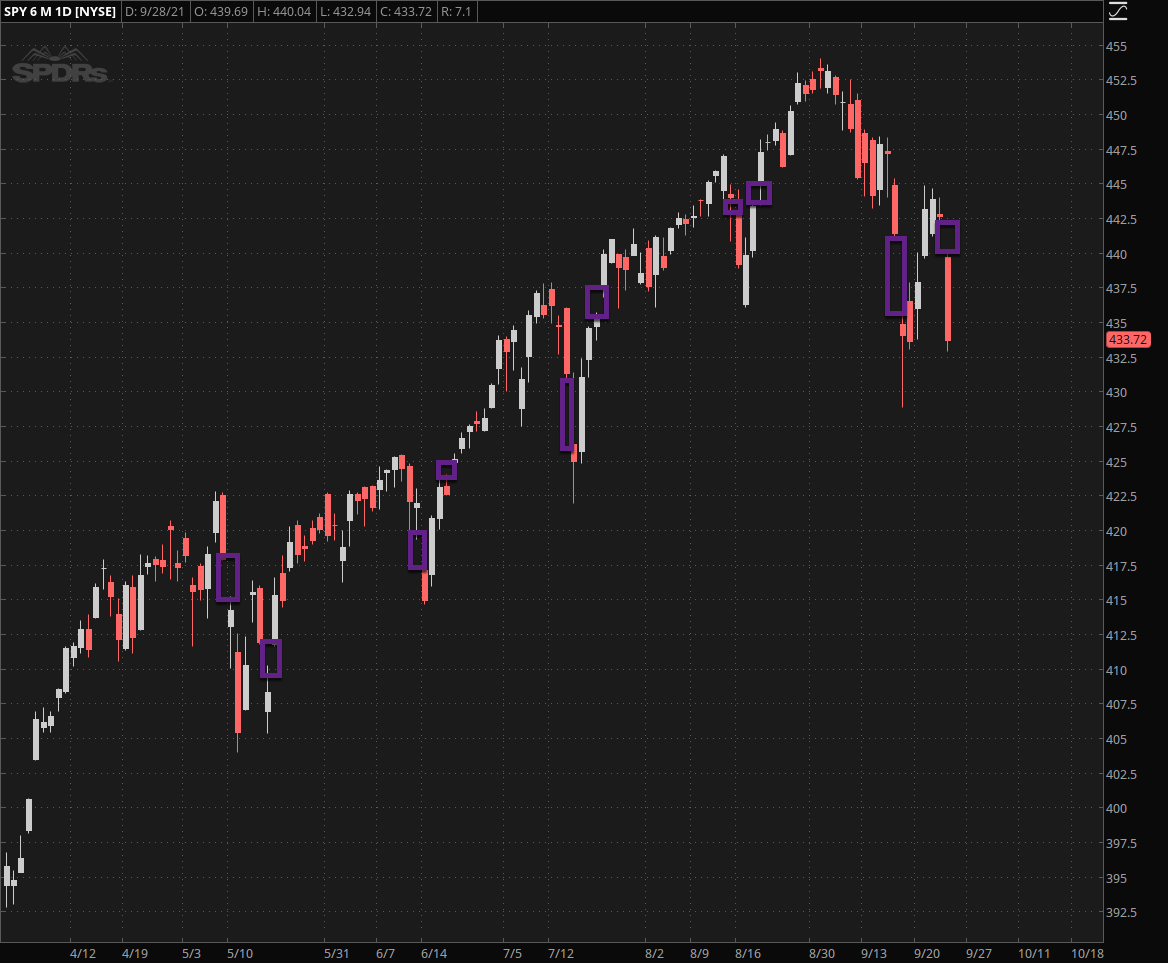
The chart above covers the past six months and during that time a very interesting pattern appears to have unfolded. Starting from the very left we see one of the most meaningful corrections in early May which was triggered by a large opening gap downward which then concluded with another gap to the upside indicating that a medium term floor was in place.
We see a similar pattern in June, in July, and most recently in August.
However yesterday morning something very interesting transpired. Once again equity investors had been rattled by a large opening gap to the downside a little over a week ago. Then they got one to the upside a few days later which – as usual – suggested we were well on our way to recovering lost ground with a shot back to those coveted ATHs.
But then something unexpected occurred – the SPX/Spiders painted a large downside gap and not just that – both then continued dropping precipitously all the way into the close.
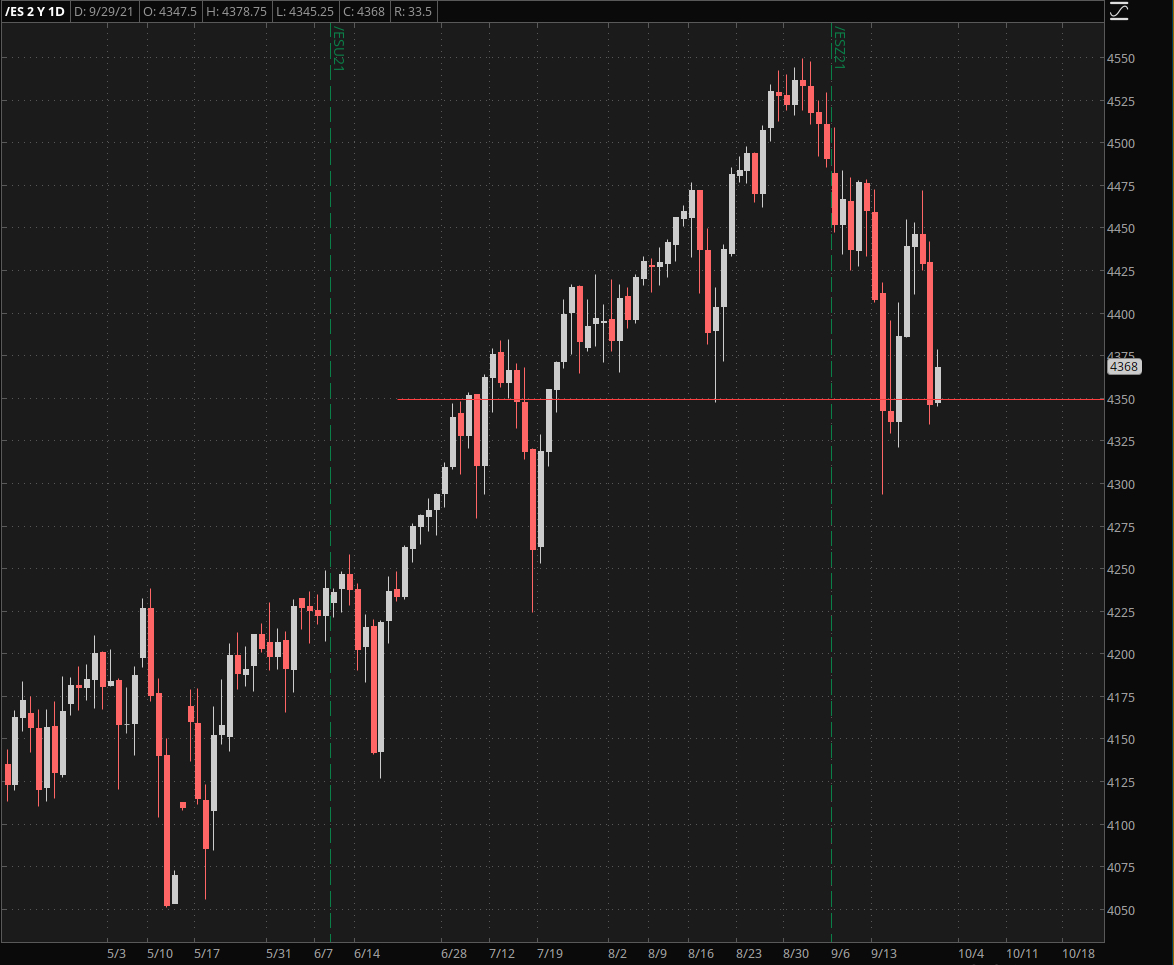
So what’s going on here? The futures chart shows us a small bounce in place. The line I you see was actually drawn on Monday and not today (Wednesday) which suggests that the spike low back in August actually has meaning and is in the process of being defended.
The rest is basic price pattern 1010 and moving forward we can conclude the following:
- A bounce from here and a breach of ES 4475 gets us back on track and we’ll most likely see a push toward new all time highs. From then on an intermediate retested low would be in place which would be difficult to overcome.
- A drop lower below ES 4100 most likely unleashes the floodgates and draws us toward ES 4225 but most likely down to ES 4125.
While we retail rats remain mostly hypnotized by the gyrations in equities the pros usually follow the bond market, which isn’t just bigger but also smarter when it comes to recognizing cracks in the market.
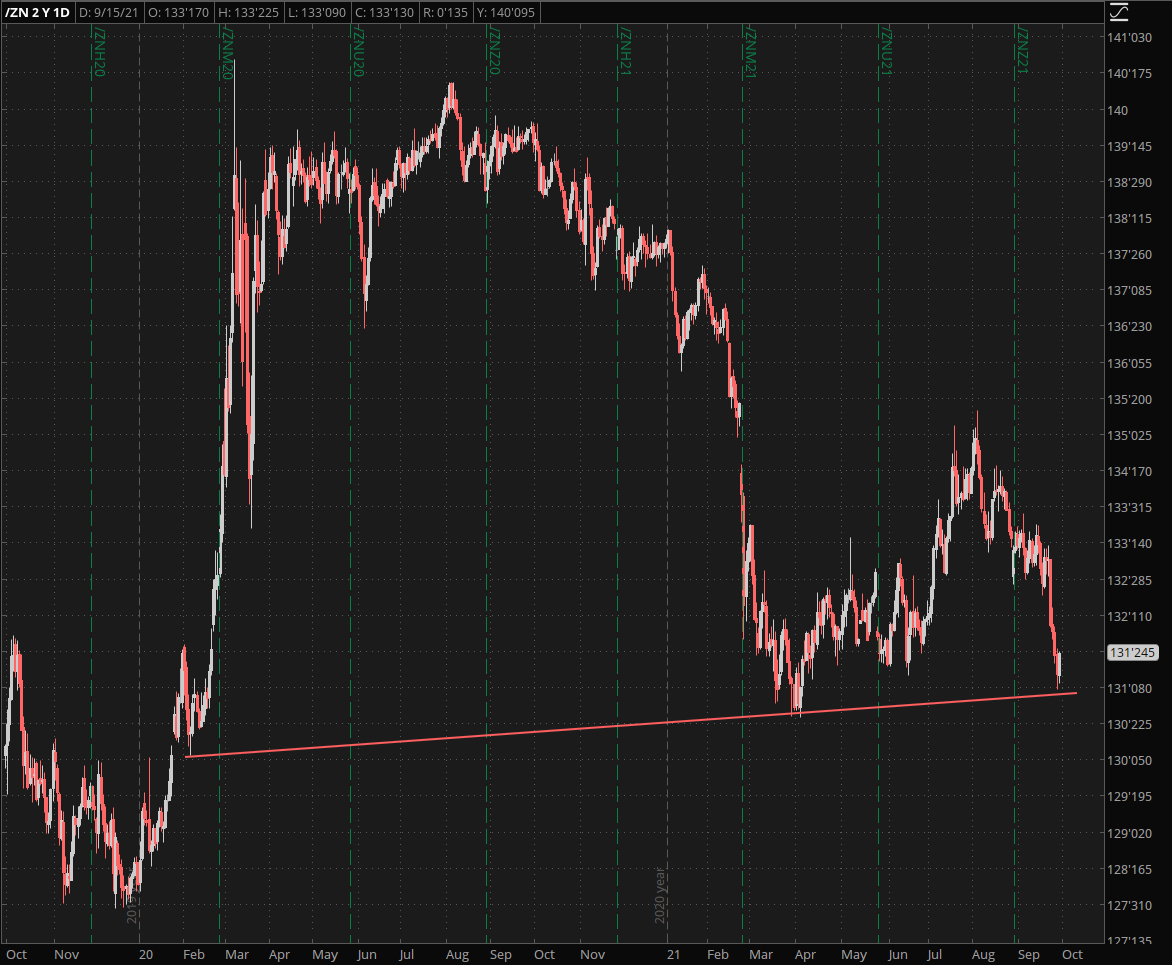
I say usually because over the past few months bonds have been pushing more or less sideways offering no interpretation of substance. This changed however in August when the ZN began to reverse and eventually picked up steam to the downside.
It’s now sitting at support and a bounce here is needed or acceleration to 127’310 is most likely in the carts.
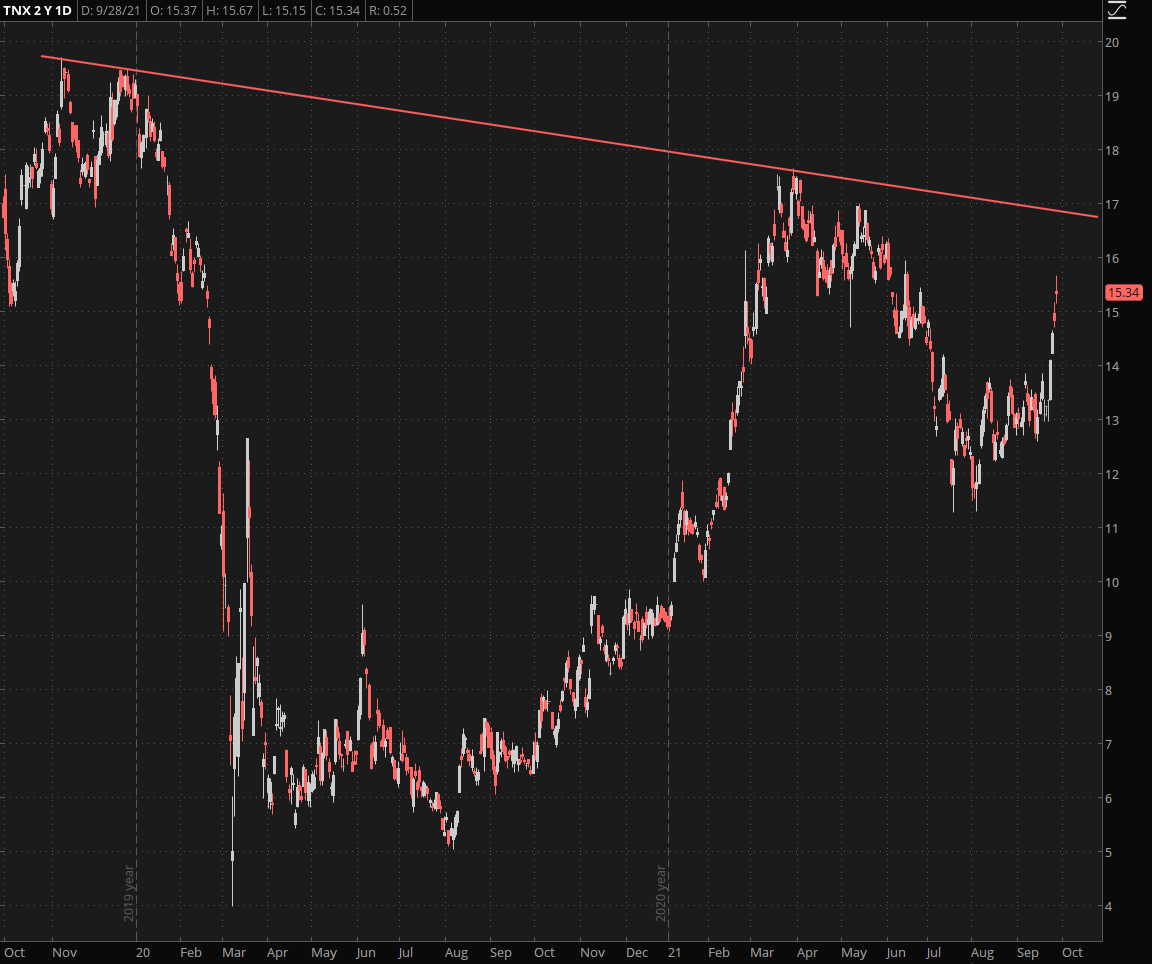
The other day I quipped that if the FOMC continued to be unwilling to raise interest rates bond vigilantes would do it for them. Of course the current stab higher barely brings us back to June territory but if this continues above 1.7% things could unwind rather rapidly.
So in conclusion I am keeping a very close eye on this chart for possible signs of the ‘big unwinding’ we may see should interest rates get out of control and finally catch up with the unmitigated rate of inflation we all have been witnessing.
To quote Abraham Lincoln: “You can fool some of the people all of the time, and all of the people some of the time, but you can not fool all of the people all of the time.” At some point something’s got to give – not the most managed economy in human history is impervious.