Things are not looking so hot for equities at the moment. In my Wednesday post I highlighted the notion that the strength of any bounce that would eventually materialize serves as a litmus test for what the fall season most likely has in store for us. Given the fact that two consecutive rally attempts did not exceed the 100 handle mark and were met by instant reversals does not bode well for the remainder of the month and going into September.
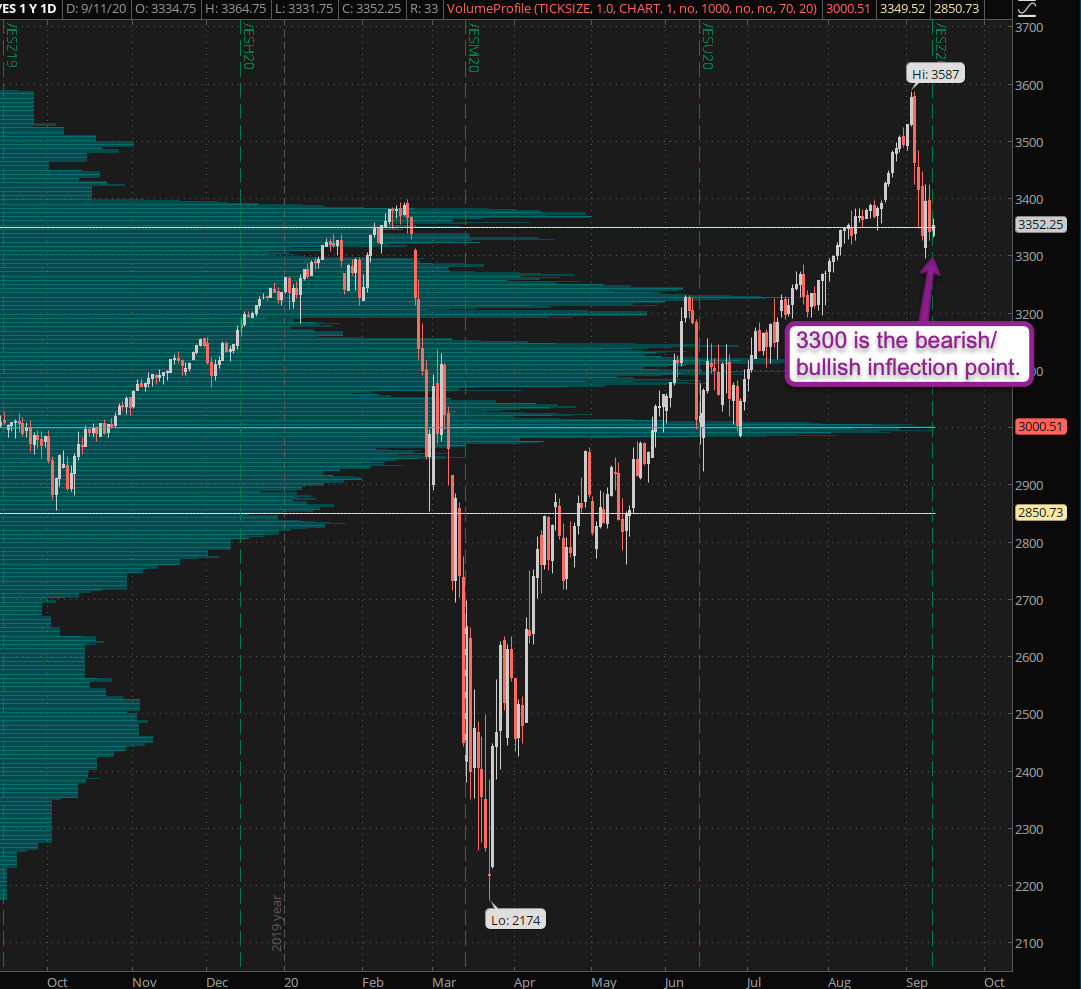
In terms of technicals the picture is pretty clear at the moment. Anything above ES 3300 until ES 3400 should be considered noise and a drop below ES 3300 has high odds of dropping us quite a bit lower, most likely toward the big 3k mark.
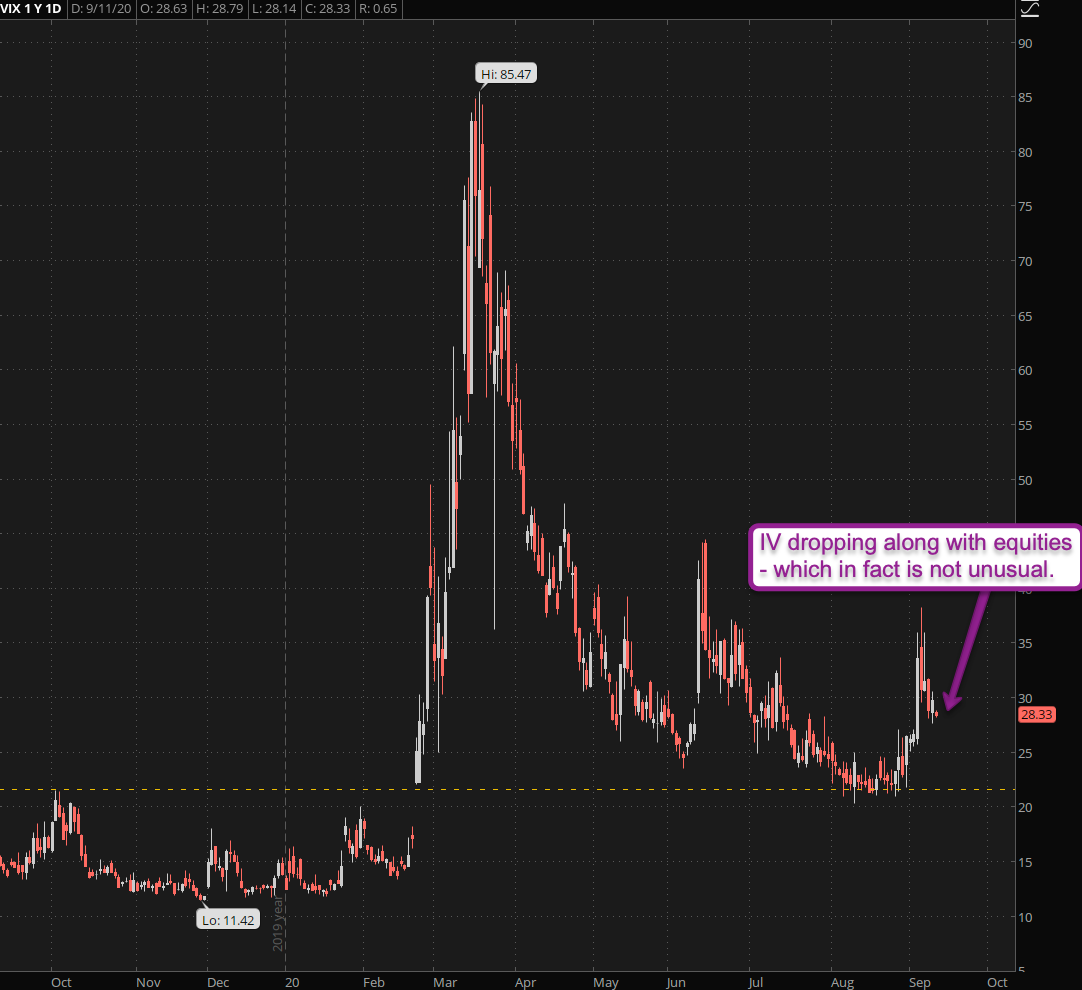
I often see less experienced market participants bemuse the fact that the VIX has fallen along with equities, assuming that it always runs inverse to equities. And nothing could be further from the truth.
To quote Ernie Chan, a.k.a. the Quant Jesus: “While a very negative return in SPY is indeed usually accompanied by an increase in implied volatility, inducing positive correlation. But on average, an increase in realized volatility due to negative returns is still accompanied by a decrease in implied volatility. ”
Or in other words – big downside moves in equities are usually accompanied by large inverse moves in the VIX. But small downside moves in equities are often accompanied by a decrease in implied volatility, effectively becoming positively correlated.
In my experience this particularly holds true after large corrections when market participants assume (often mistakenly) that the ongoing correction has run its course and that a bounce is on the horizon. Remember, we are talking about ‘implied’ forward looking volatility here.
And this is not something a stable of Russian quant PhDs. are somehow conjuring up in some secret basement over at Goldman Sachs. In fact the VIX and the implied volatility it is being calculated from is a direct result of the option trading activity on the CBOE. As such it reflects the collective perception of forward risk by tens of millions of market participants.
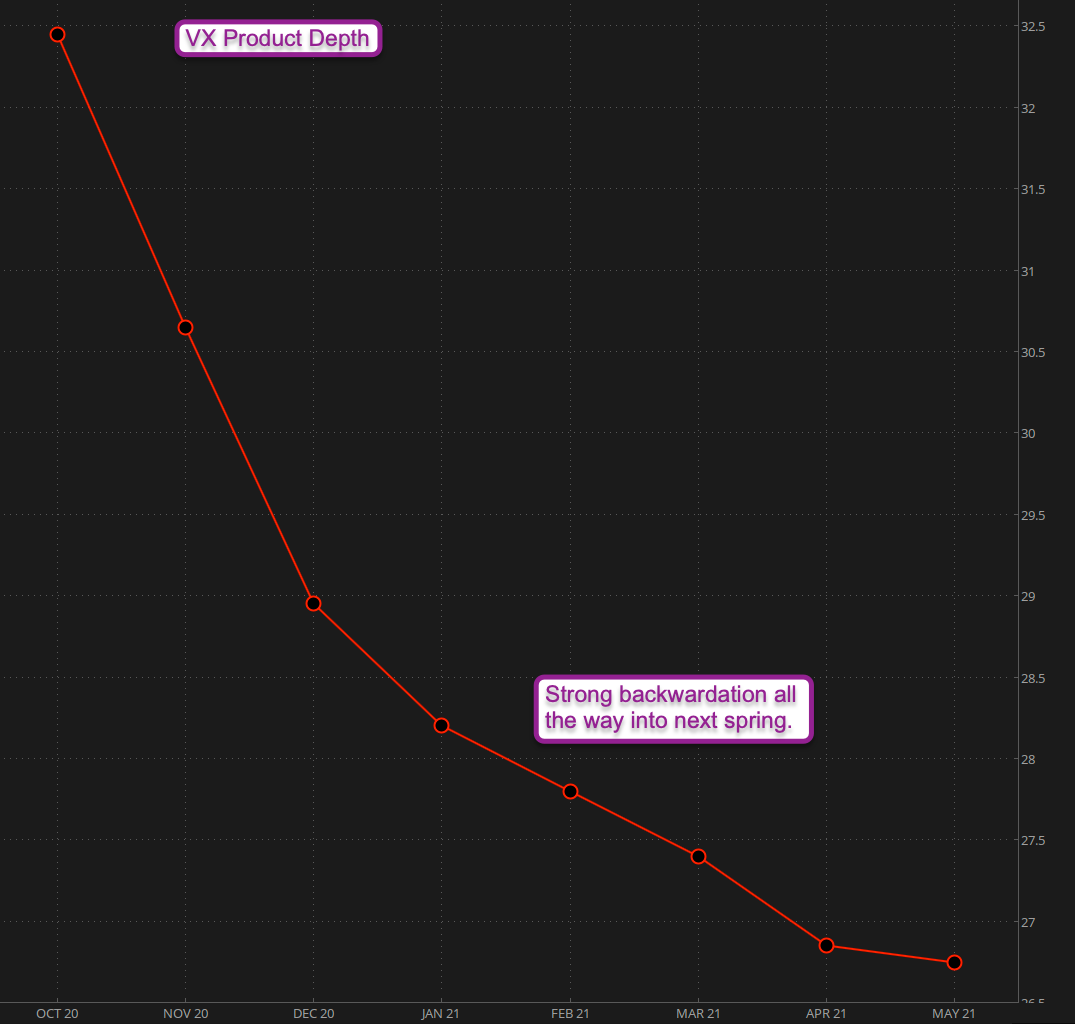
Speaking of implied volatility, the product depth graph on the VIX futures (or VX) continues to point toward gradual normalization over the coming months and going into the next spring. I really hope this proves to be correct as we’ve all had enough chaos and drama for the remainder of this decade.
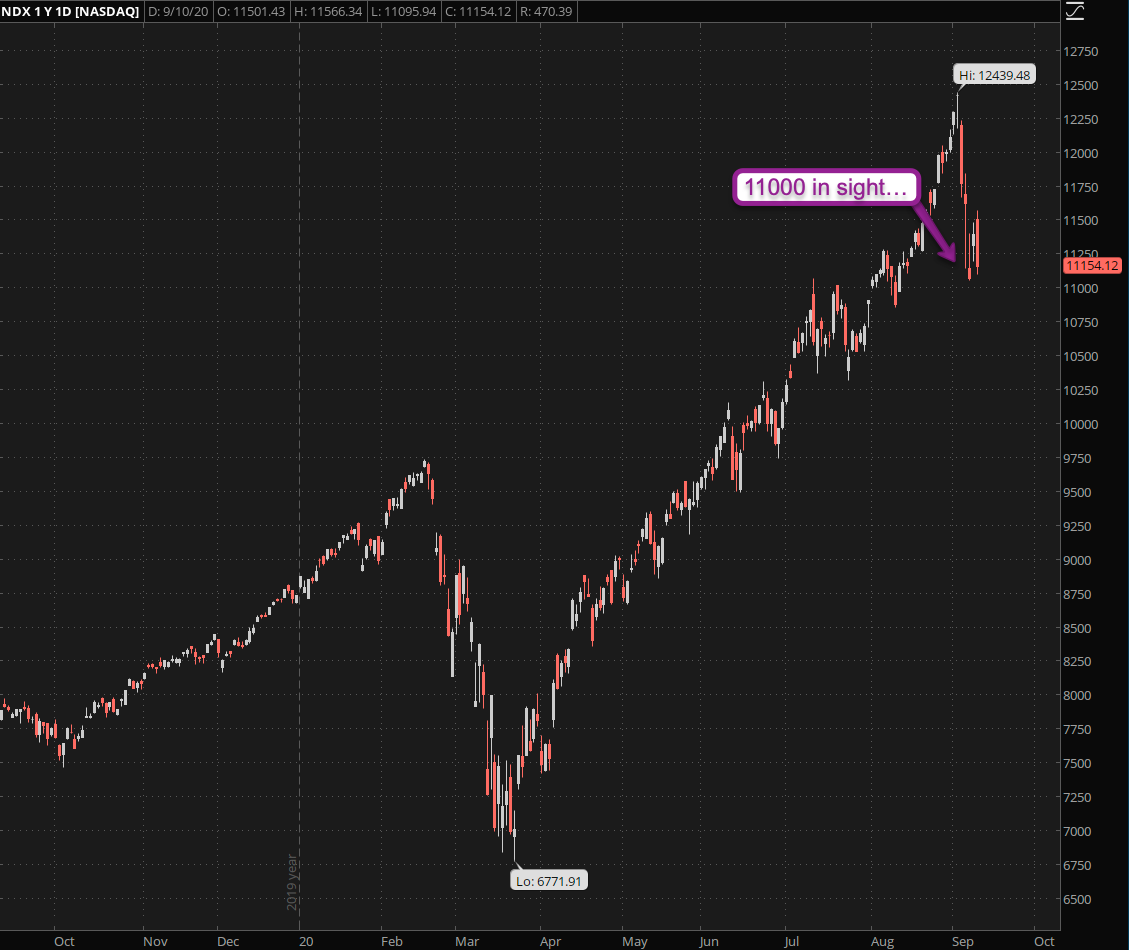
Per the title of this post – the important take away of this ongoing market correction is what sector(s) have been mainly affected. And for that we can squarely point at big tech and all the little boats it has been floating over the past few months.
Just like Icarus after ascending too high way too fast, tech stocks ended up tumbling back toward the ground, once again proving the fact that you can defy the laws of physics (or that of supply and demand) only for so long.
Please log in to your RPQ membership in order to view the rest of this post. Not a member yet? Click here to learn more about how Red Pill Quants can help you advance your trading to the next level.