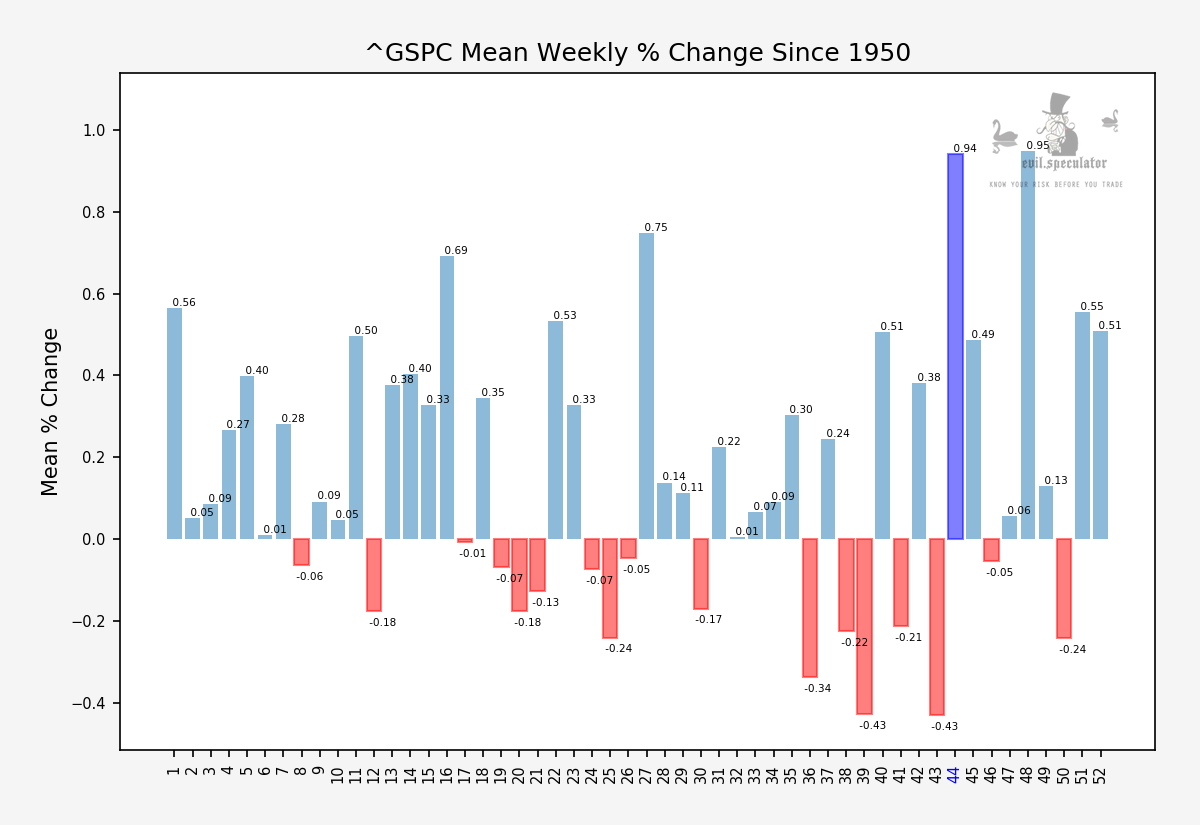
I’m going to lead today’s post with some of the weekly stats I shared with my subs on Monday which do a great job in shedding more light on this week’s wild gyrations. In a nutshell: On the surface week #44 had the potential to be the 2nd best earning week of the year but it came with a twist, which was that its positive Sharpe ratio was mainly due to large outliers. As a whole the final trading week of October is volatile mess with a positive SKEW – meaning that it is distributed toward the bearish side.

Here’s the weekly SKEW graph and as you can see there are only a handful of weeks in the year that feature a positive reading. But what does it mean?
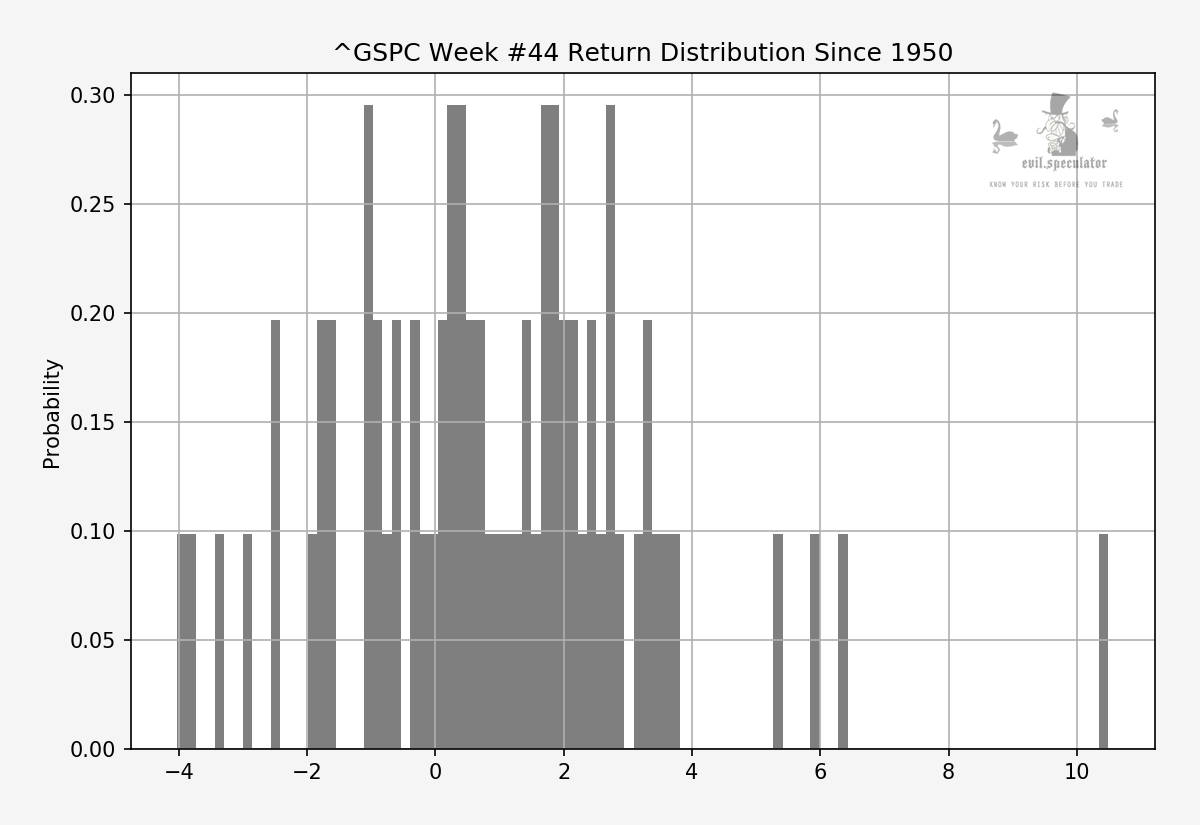
This may shed some light on how large outliers can fool you. A positive SKEW does not necessarily mean that negative weeks dominate the stats. What it does show is that the distribution of the dataset leans toward the left.which however may or may not push into negative territory.

That means that you can easily have a dataset comprised of only positive values that however features a positive SKEW. I wanted to point this out expressly as it is something that confused me a little once I started to dig a bit deeper into statistics.
This may sound all purely academic but from a trading perspective this is important. Given that the stats suggest a positive week on average it’s easy to forget that the outliers are pushing the average above other weeks.
That’s not a big problem in itself of course especially if you are trading in a low volatility market cycle. It can turn into a big problem (or opportunity of course) when you find yourself in the 2nd busiest week of the year in terms of realized volatility, as is expressed by the weekly % change.
Probability Of Profitability
So no matter where we would end up this week it was clear that it would not be via a slow orderly trajectory. And that can hugely affect your trading reality, especially if you are trading with hard stops via automated or discretionary systems.
I spoke of opportunities and by that I mean the ability to benefit from large swings as the ‘probability of touching’ a price range – especially near the weekly expected move – jumps significantly. An industry term for this is the ‘probability of profitability’ (POP) which I explain in detail in my forthcoming butterfly course.
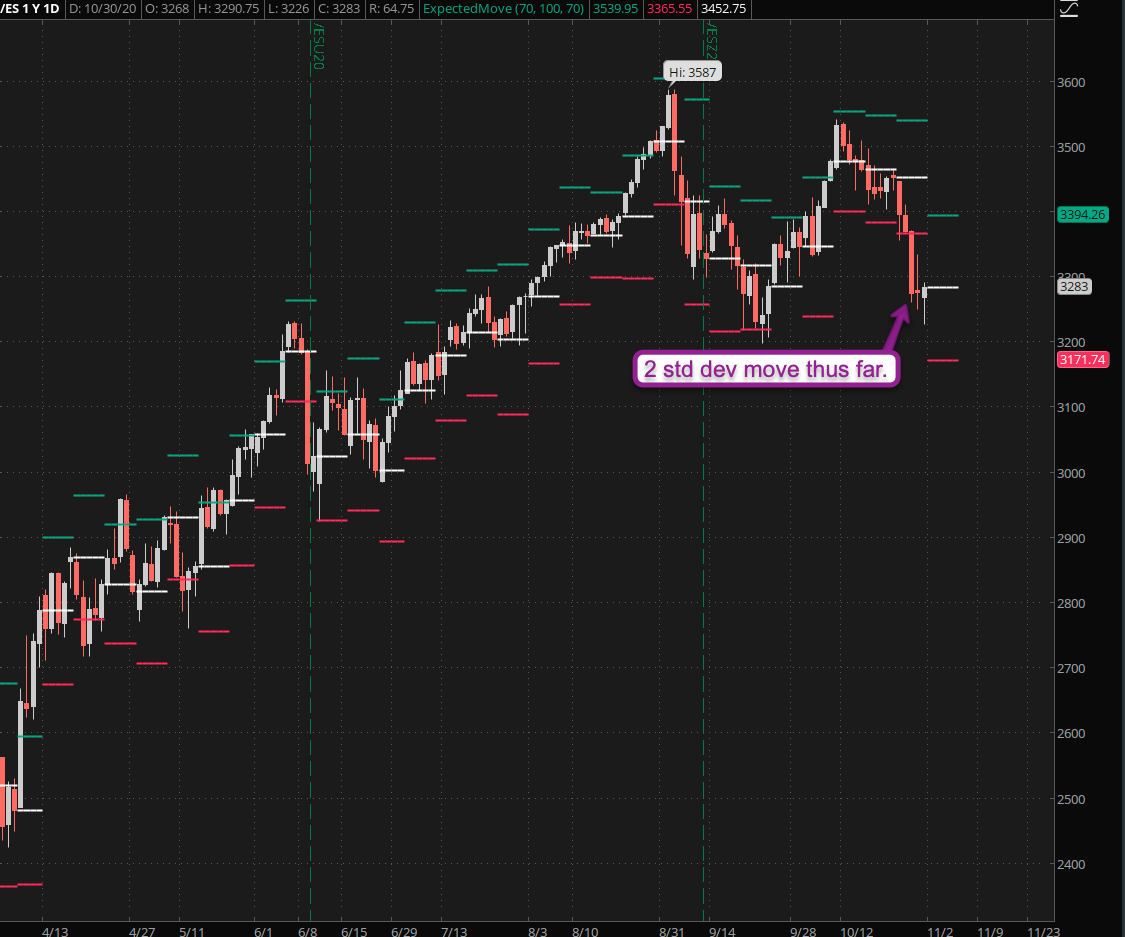
Which brings me to today’s launch pad in the SPX which yesterday closed far outside the weekly expected move. In fact as of this writing the spoos are still trading about 2 standard deviations away from where we started the week.
This is going to create quite a bit of turmoil in hedging activity as anyone having sold OTM puts is feeling the pinch is busy selling ES futures to compensate for the loss. Again this is something I will cover in exhausting detail in my upcoming course.
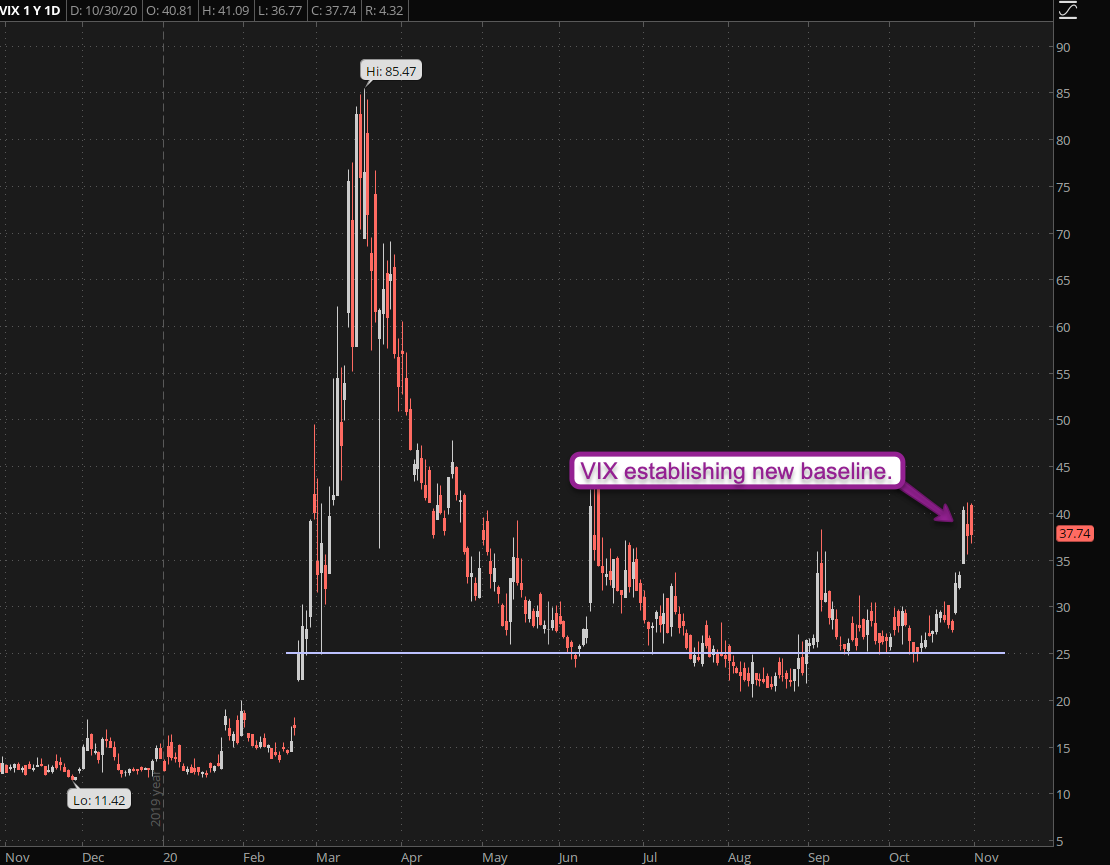
Seems the VIX is getting ready to establish a new base near the 40 mark ahead of the Tuesday election. Who will up winning is anyone’s guess at this point (if you ask the MSM – your mileage may differ) but I think it’s clear that the market collectively has written off the potential of a clean transition into the 46th presidency of the United States.
Please log in to your RPQ membership in order to view the rest of this post. Not a member yet? Click here to learn more about how Red Pill Quants can help you advance your trading to the next level.