In my Monday post we took a snapshot of the short to medium term risk perception courtesy of the VX futures term structure and compared it with the one we saw in November. What we discovered was that implied volatility (and thus risk perception) has steadily dropped lower but that the steep contango had remained intact. Thus my suggesting a chronic manic depressive marketplace, which I find rather appropriate given that equities are not just trading at all time highs but are now pushing into ever loftier heights every single session.
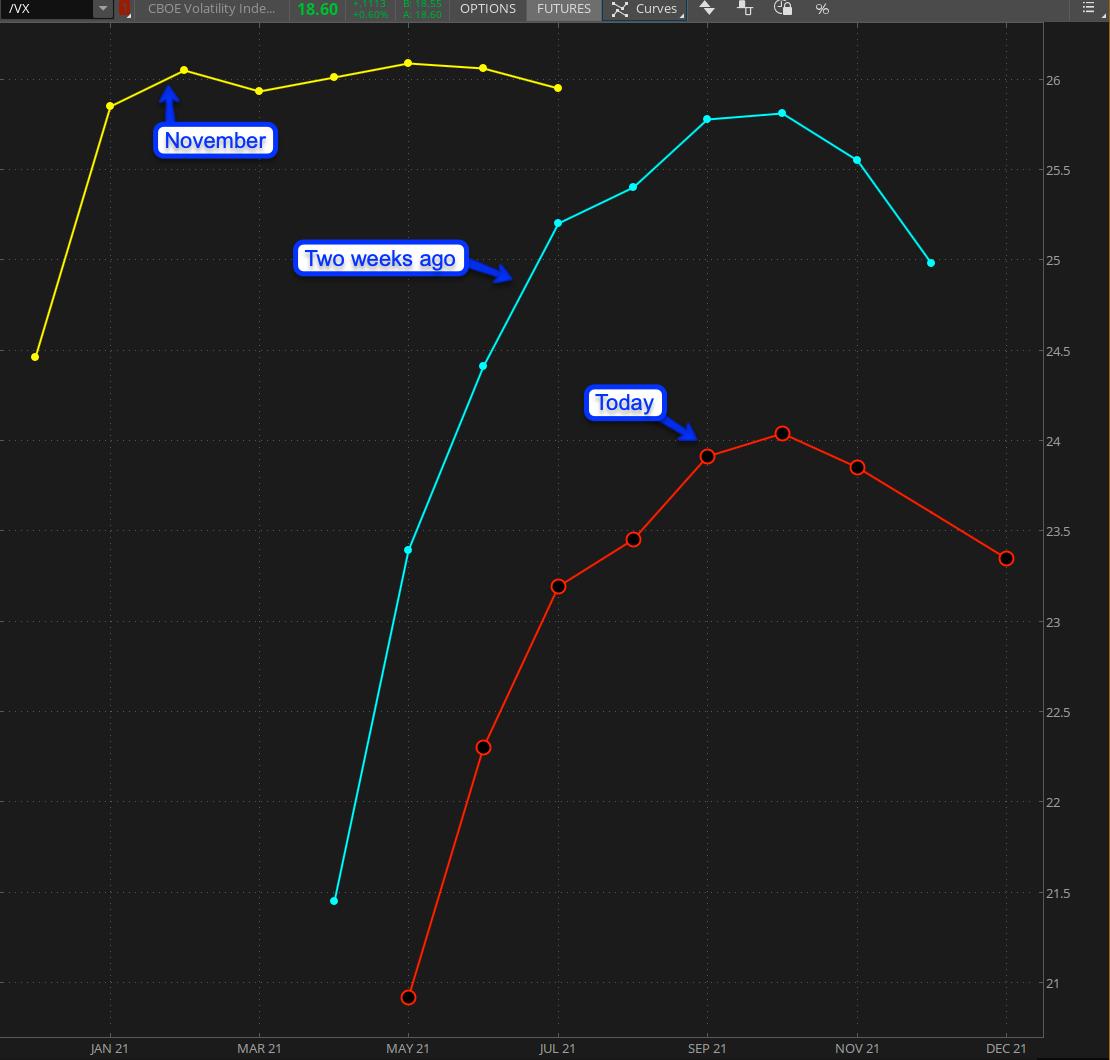
Here’s a handy comparison graph that illustrates this rather nicely. The red line obviously shows today’s VX contracts going into December, while the cyan shows where we were two weeks ago. The yellow line shows the sentiment in late November during the post election drama.
What’s apparent here is that something very fundamental just changed. If you compare the six month outlook just two weeks ago with the one in November then you’ll note that it wasn’t significantly lower. That however has changed this week and we are now trading in a completely different marketplace. From an options trading perspective for example that is a crucial take away.
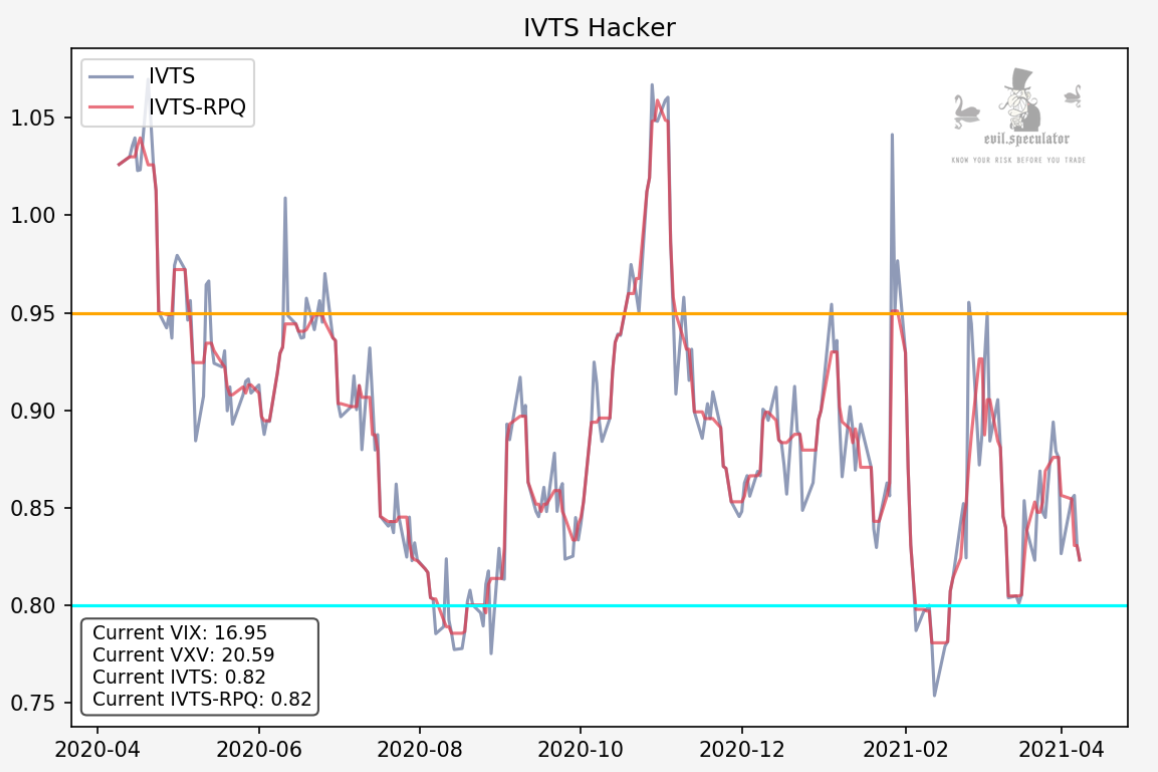
Here’s the IVTS hacker graph which has been fairly stable between the 0.8 to 0.9 mark. This graph directly affects the way I look at short term IV in comparison to quarterly IV. With SKEW now dropping across the board (except in a few select contracts) the fun time of selling OTM options have come to a rapid end.
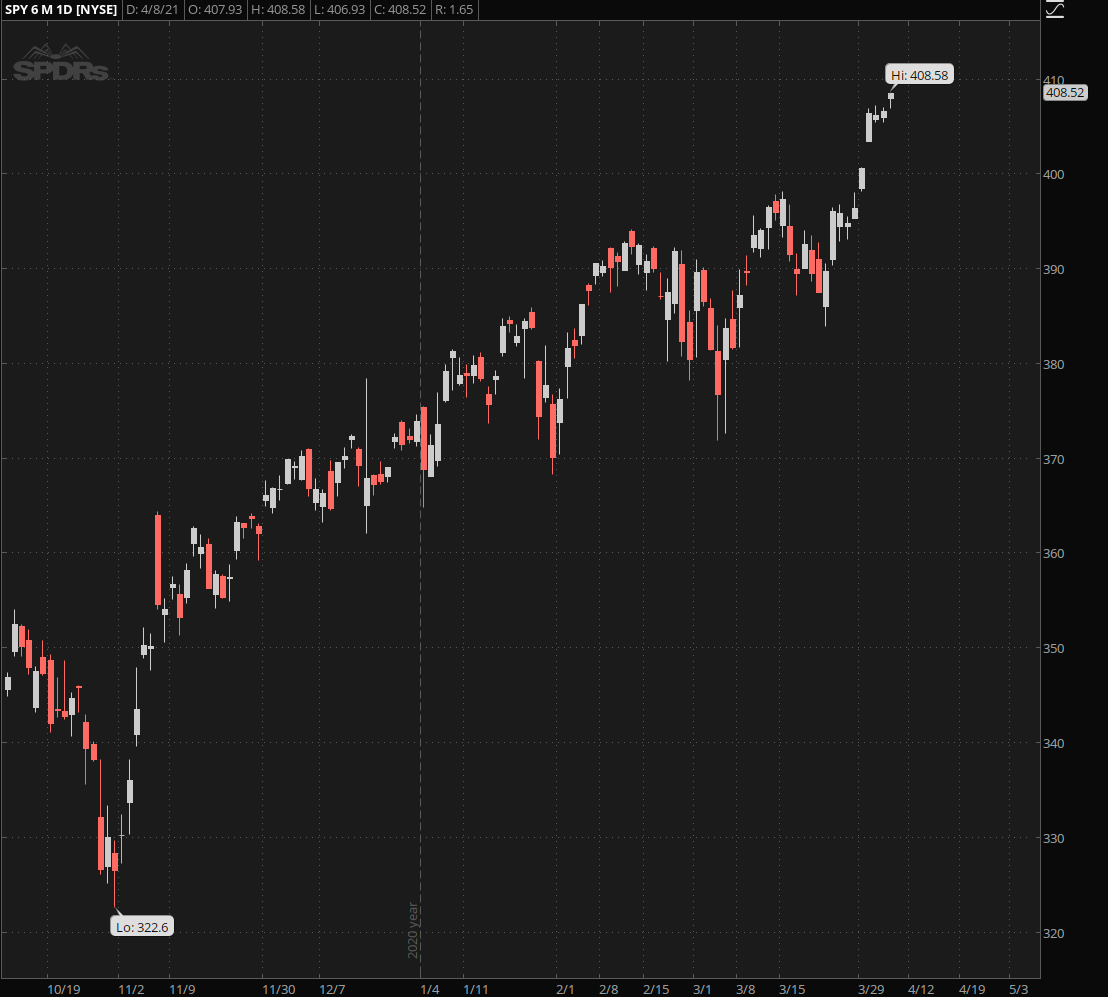
Call it what you will but this is a bull market and as I mused on earlier occasions, it wants to go up up up and then some. Note the lack of indicators or any other market measure as price alone speaks bounds here.
Pro tip: If you find yourself in a market that continues to paint large opening gaps almost every single day for a week then you must abandon any bearish inclinations you may still be clinging on to. That also applies to any bearish positions. Price after all is the ultimate arbiter of truth in the financial markets.
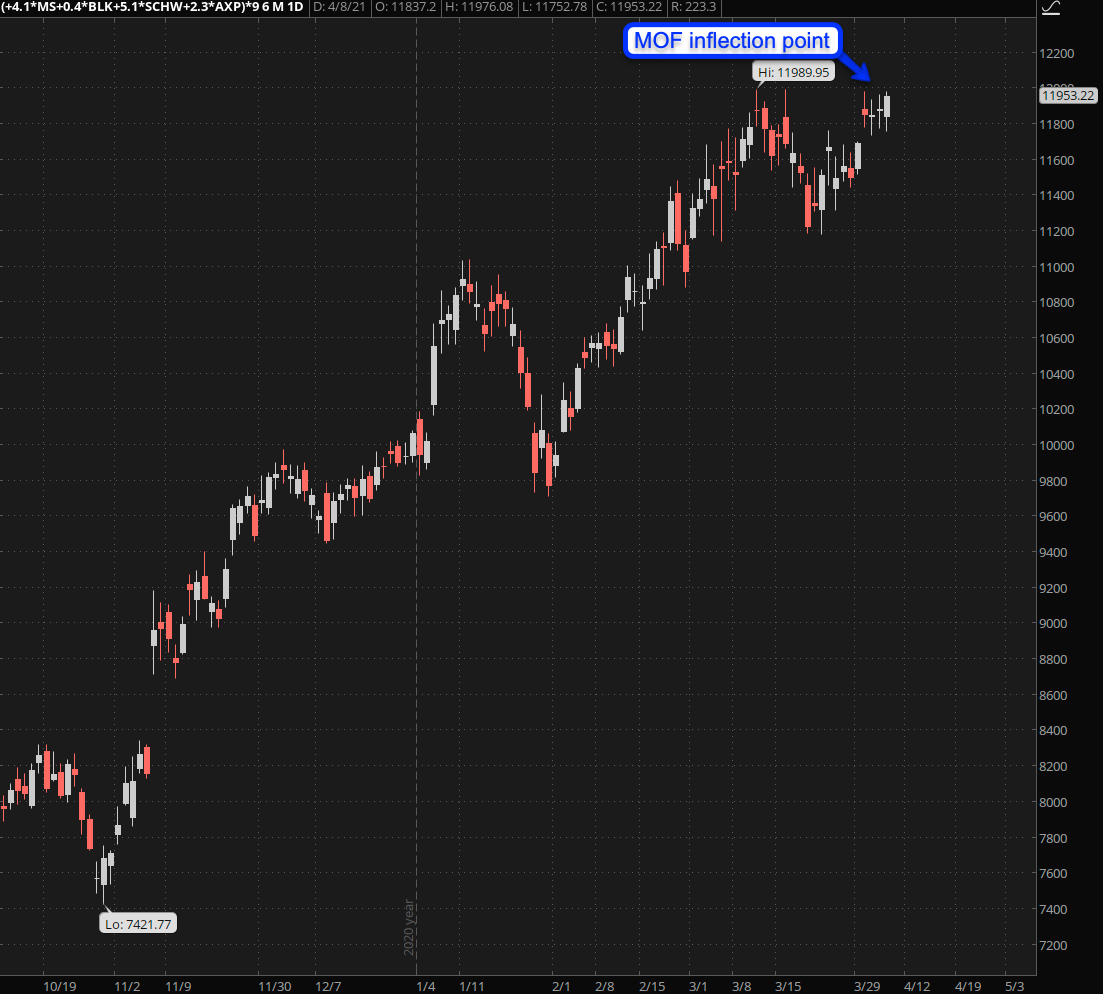
What’s driving it? It used to be finance but sector rotation now rules the day and we are currently in a finance off / technology on market phase.
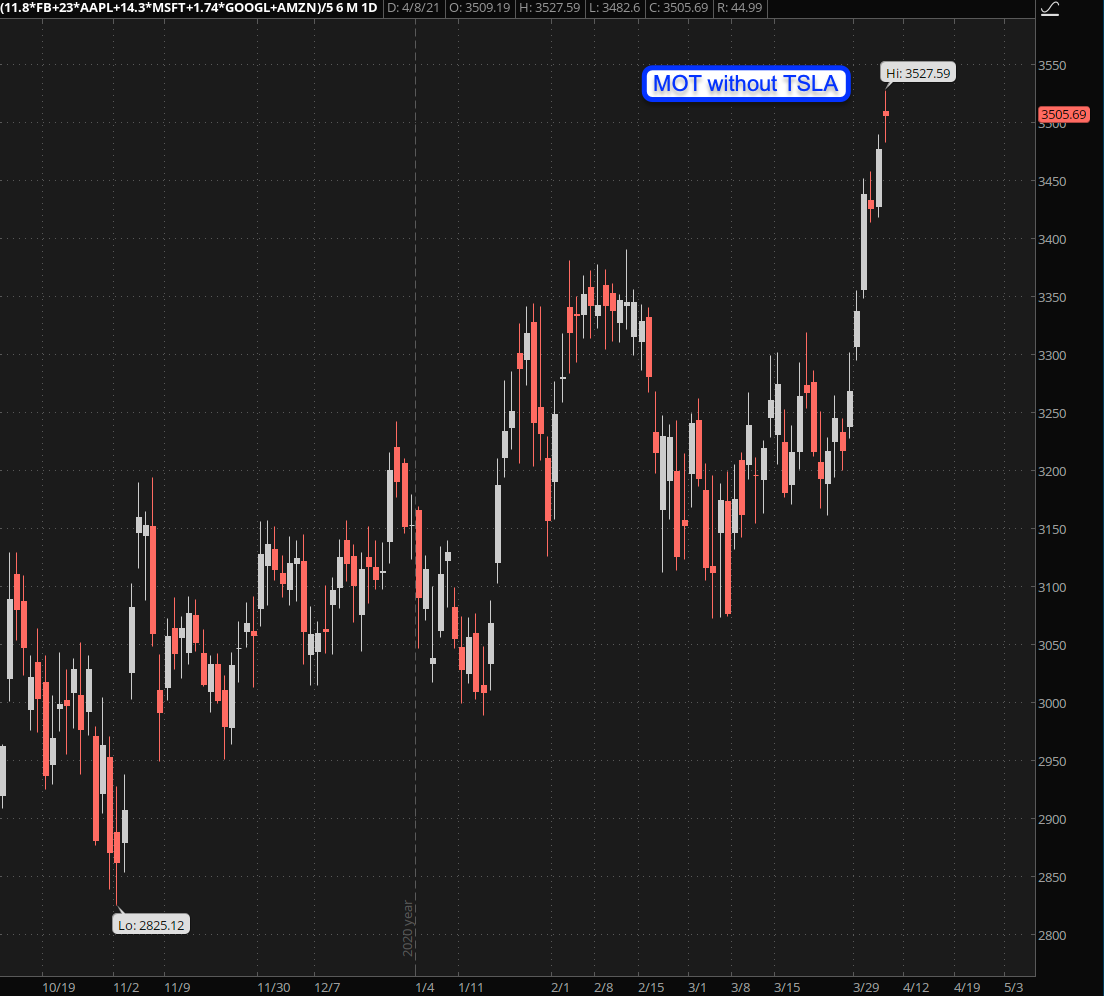
Here’s my ‘monsters of tech’ composite symbol excluding TSLA. I wonder how this is going to play out given that we are supposedly in a global silicon drought but quite frankly doing the opposite of what’s been suggested in the MSM has always paid off well for us, so let’s not get distracted by the noise and focus on what price is telling us.
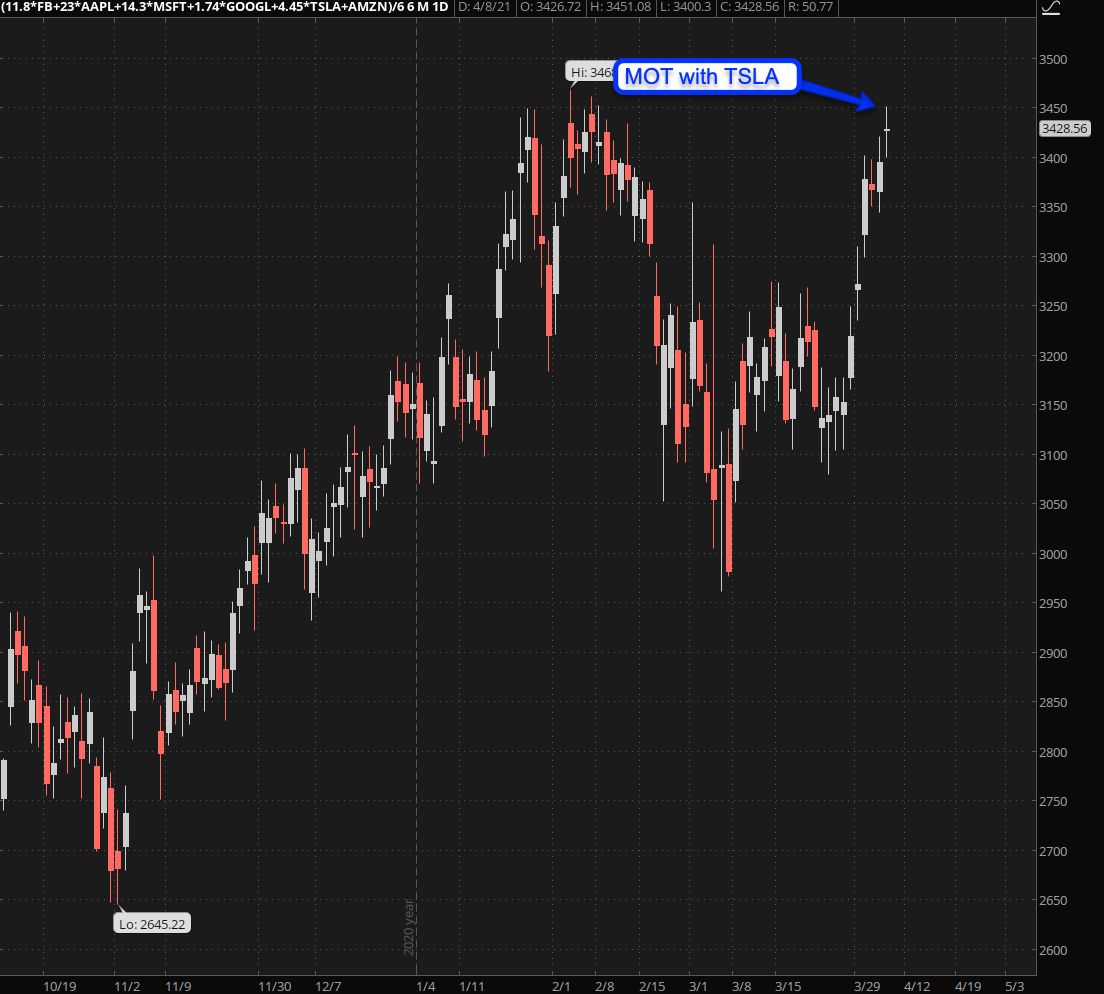
BTW, here’s the same composite symbol but with TSLA added. Clearly it’s dragging the sector down a bit right now but that actually gives me an idea for two great setups:
Please log in to your RPQ membership in order to view the rest of this post. Not a member yet? Click here to learn more about how Red Pill Quants can help you advance your trading to the next level.