It’s all over the news. The U.S. housing bubble, the stock market bubble, and now the crypto market bubble. In fact since the onset of the 21st century we have seemingly stumbled from one market bubble to the next.
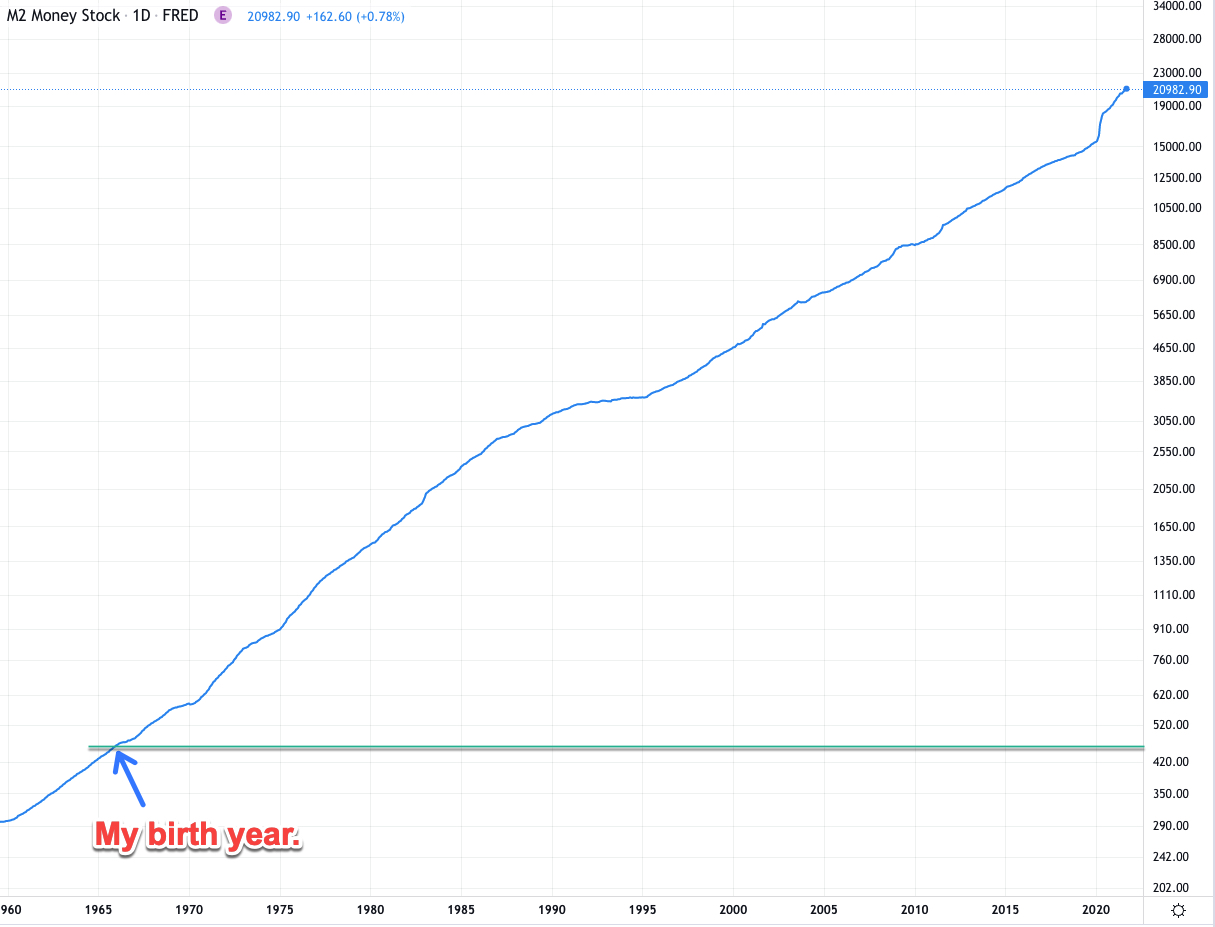
Here’s a chart of the M2 money stock of the past 60 years as published by the St. Louis Federal Reserve.
It’s a bit of a dry tulip but bear with me. So M2 is a measure of the money supply that includes cash, checking deposits, and easily convertible near money, whatever that is.
So M2 is basically a broad measure of the USD money supply and per Wikipedia ‘is closely watched as an indicator of future inflation, and as a target of central bank monetary policy.’
Now you don’t have to be a world class analyst to project a rough trend line here. And barring a complete break down of the USD as the world’s reserve currency (no longer a conspiracy theory) it’s most likely never going to swing back the other way.
You also don’t need to be an expert in macro economics to understand that if you create more and more of something it’s increasingly going to be worth less and less?
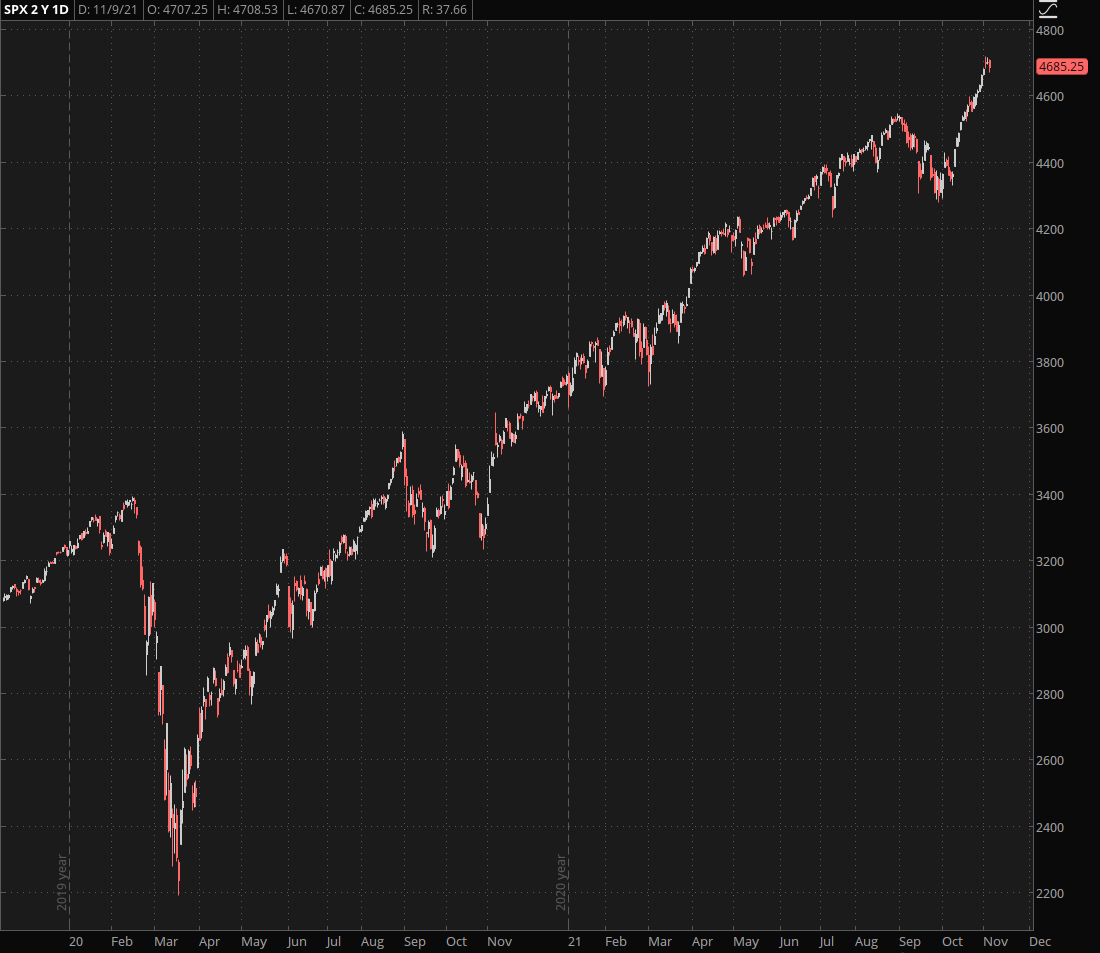
Keeping that in mind it’s no big surprise to see charts like this one.
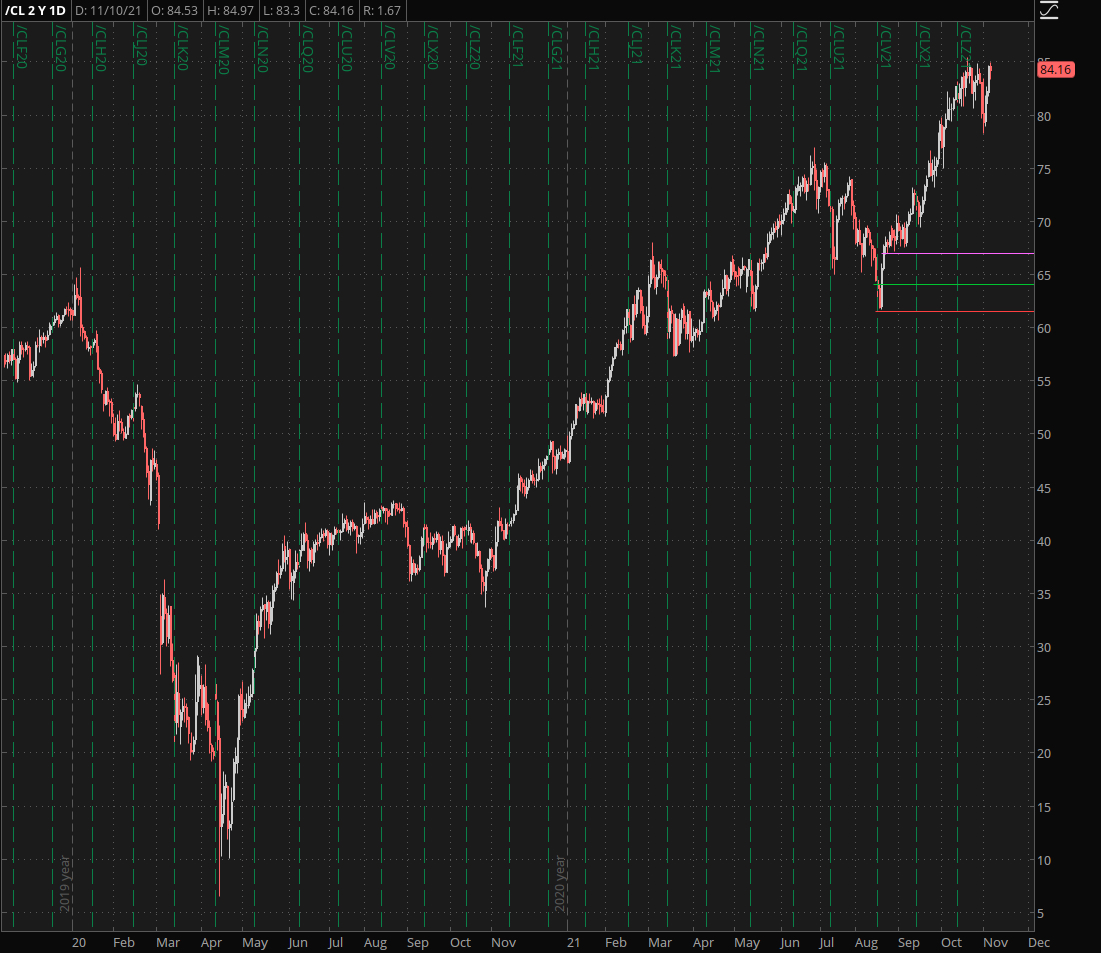
Or that one.
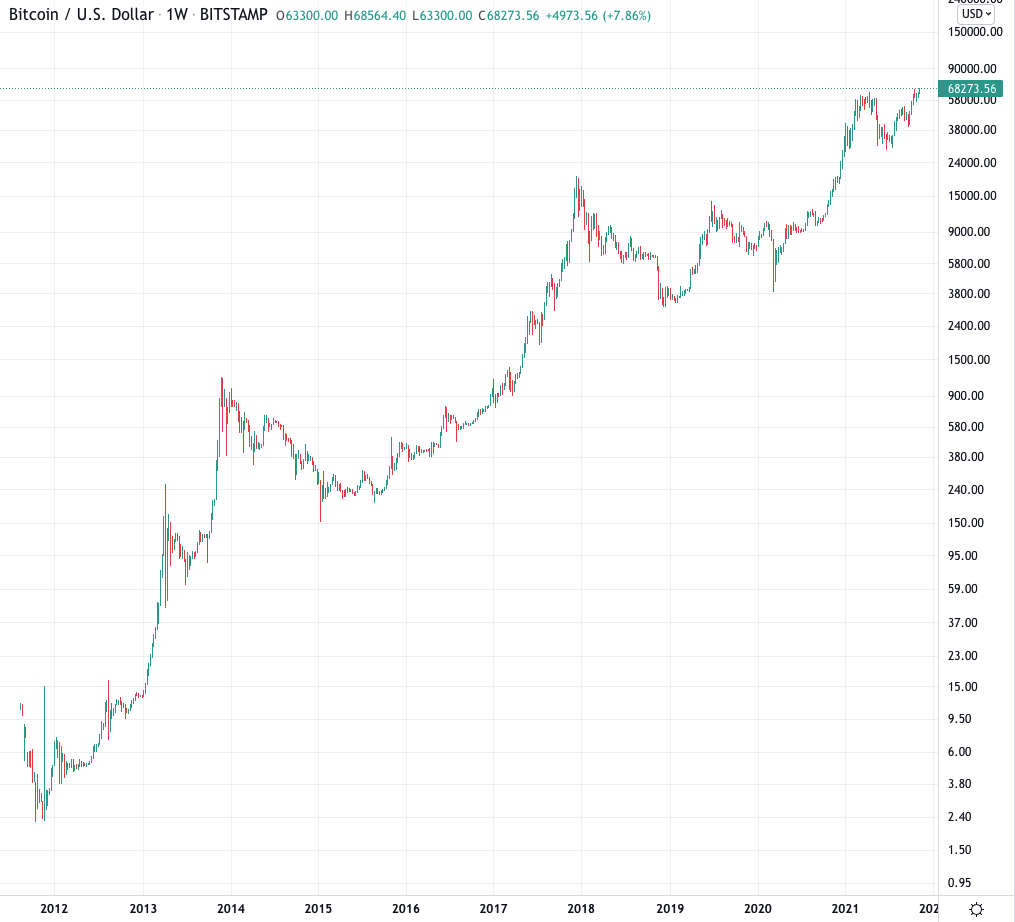
Or this one of course.
In fact Bitcoin’s creation was the direct result of the financial crisis in 2008. To me there are two things that come to mind when looking at this chart.
- The biggest bull market ever in human history.
- The biggest capital flight ever in human history.
If this doesn’t give you pause then I don’t know what will. Nobody in their right mind wants to hold fiat currency for extended period of time anymore.
And let me tell you as a German who has studied the excesses of the Weimar Republic: Once hard cash is considered toxic bad things usually happen to economies.
All that excess capital has not only changed how the financial markets work. Over the course of the past decade it has slowly infected wide swaths of the investor class with a bipolar disorder.
While we are constantly reaching for the stars (i.e. are chasing the next bubble) while we are at the same time in permanent anticipation of the floor falling out below us.
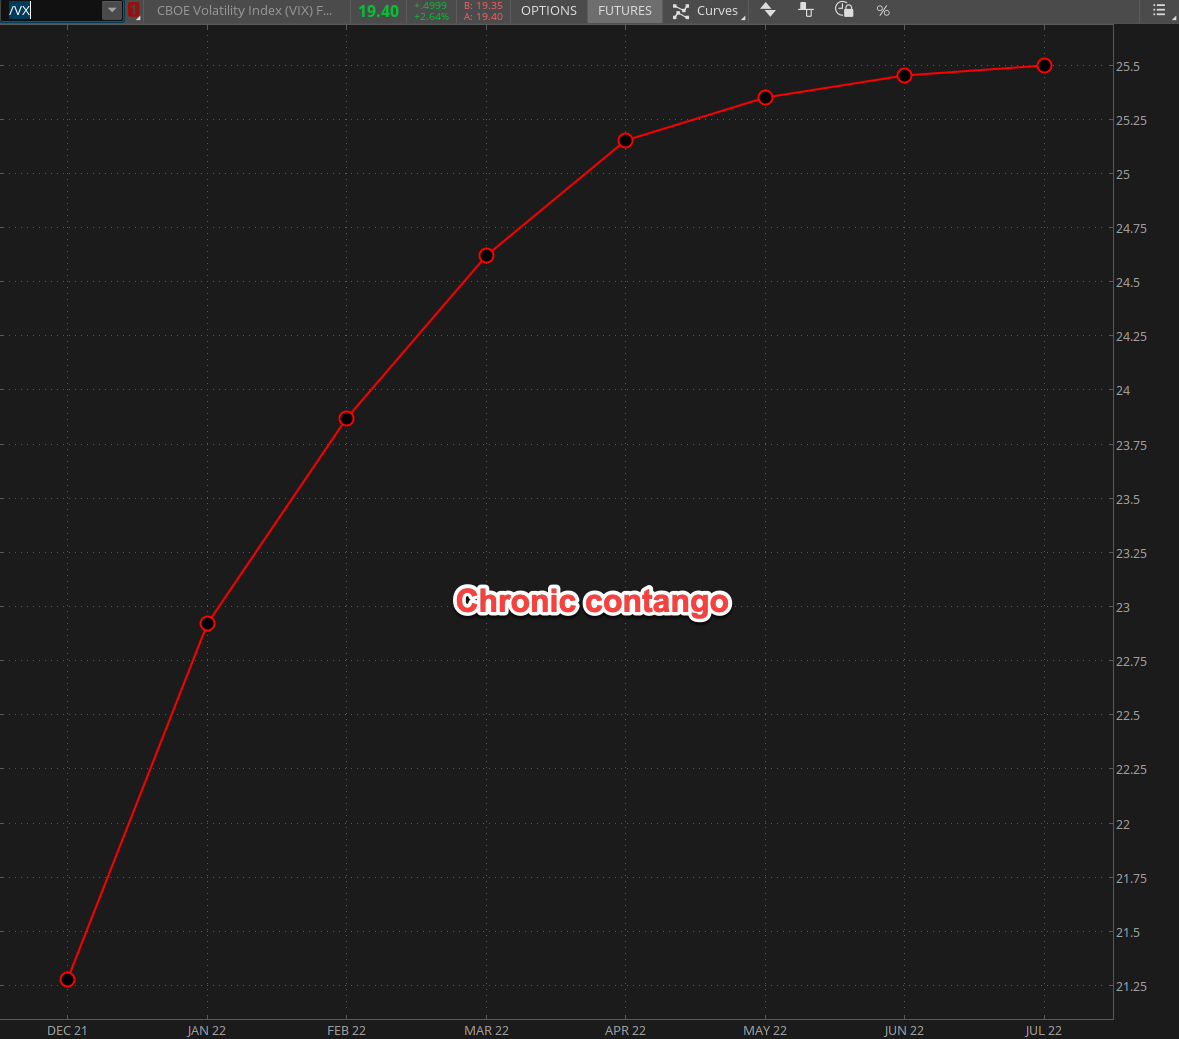
Case in point the excessive contango we keep seeing in the VX futures plus the front month contract now habitually trades 2 to 3 handles above the VIX.
So what does this all mean from a trading perspective?
Please log in to your RPQ membership in order to view the rest of this post. Not a member yet? Click here to learn more about how Red Pill Quants can help you advance your trading to the next level.