In my Wednesday post I introduced the Z-Score and also explained how we use it for scoring implied volatility, making it the IVZ-Score. What I didn’t focus on much is why one would do such a thing in the first place, and the underlying purpose may not be immediately apparent to some. Now I already can sense your eyes glazing over plus it’s Friday, so I’ll promise to make this brief and actionable for non-nonsense traders mainly interesting in turning a buck.
As I’m a visual guy I always enjoy plotting things as opposed to just looking at a set of numbers. Since I understand basic algebra however an IVZ-Score of let’s say 1.5 does tell me quite a bit about how to interpret risk pricing of a particular asset.
Tony and I have run the numbers and do know how to shift our strategies should AAPL for example push to an IVZ-Score of 2.5 – or minus 2.5 (which obviously happens a lot more rarely). But what if it AAPL pushes all the way to an IVZ-Score of 4.2 – what does that mean to us?
Well, the stats actually suggest that anything beyond an IVZ-Score of 2 usually results in mean reversion before the EOW – under normal circumstances. Clearly it’s not something we saw during the February wipeout during which we saw wide swaths of symbols push into an IVZ-Score of 4 and above.
The Problem
The issue we are facing here is one of context – which is a common affliction when it comes to interpreting implied volatility. Statistically speaking what is the difference between an IVZ-Score of 3 and an IVZ-Score of 6? Should we try a mean reversion trade starting at 3 or at 4, or perhaps wait for 6 – should it ever arrive?
A Possible Solution
One of my intrepid readers and part time quant who calls himself ‘Bob The Horse’ sent me a sweet little mathematical nugget I decided to put to the test. The basic idea of his adjusted formula is to create a bound range between -100 and 100 which can be more easily interpreted as it aims to convey statistical probability.
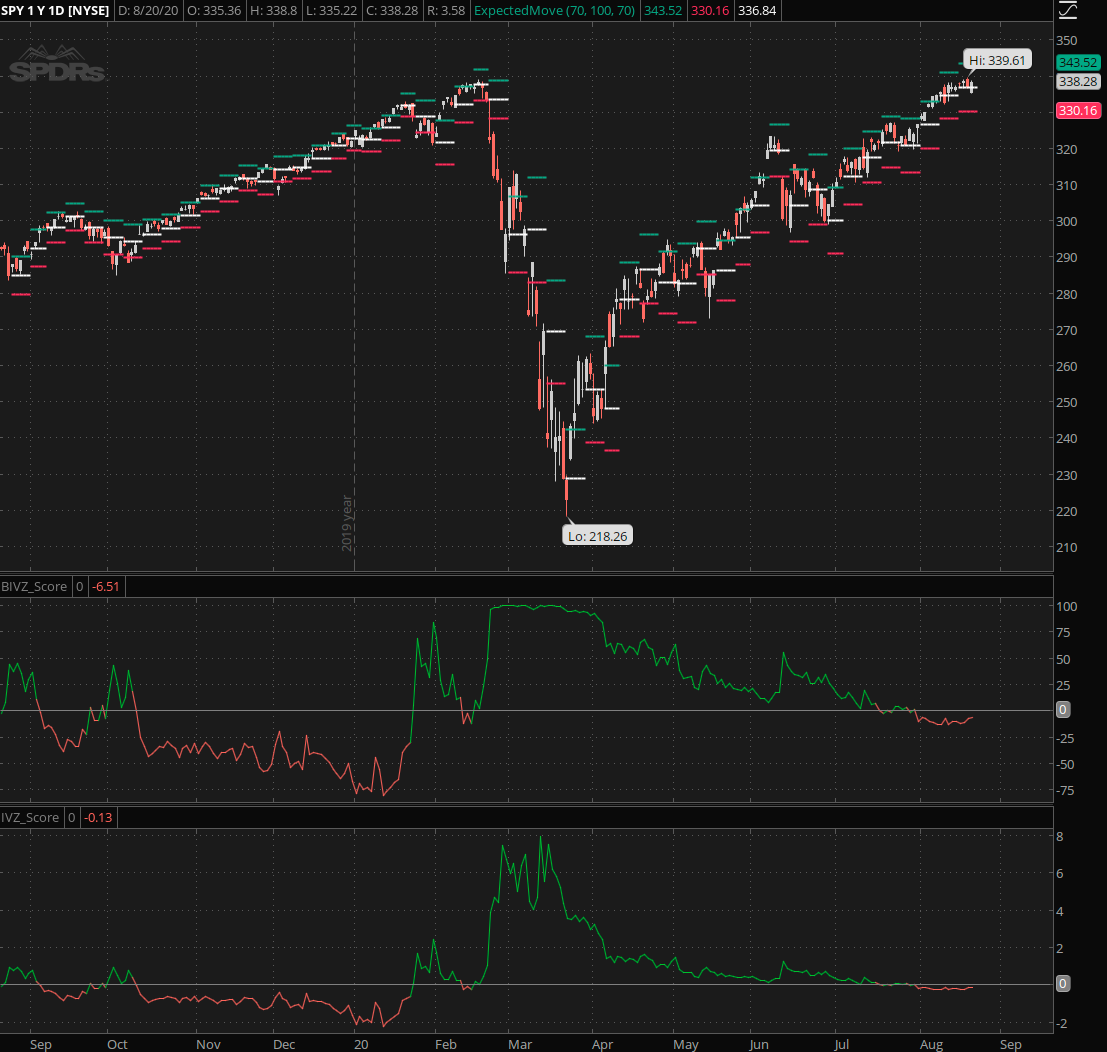
Before I share the formula let’s just look at both our good old vanilla IVZ-Score in the bottom panel in comparison with what henceforth shall be known as the BIVZ-Score in the middle panel – which either stands for ‘Bound IVZ-Score’ or ‘Bob’s IVZ-Score’ to honor its creator.
What immediately becomes apparent from plotting the signal is that there is not much difference between an IVZ-Score of +4 and +6. And that makes complete sense if we reflect on the fact that there never is such a thing as an ‘overbought’ or ‘oversold’ market. Like a stochastic or a MACD implied volatility seems to become ’embedded’ once it reaches a threshold of 90% or above.
This is a lesson I had to learn the hard way back as a fledgling trader and seeing it as a simple graph is hugely helpful, at least in my book. Now before we move on to a few more examples let’s take a look at the formula:
Please log in to your RPQ membership in order to view the rest of this post. Not a member yet? Click here to learn more about how Red Pill Quants can help you advance your trading to the next level.