As humans, we have an extremely poor ability to judge statistics. It’s one of the key reasons that casinos anywhere on the planet not only exist, but thrive. Most of us know that in a casino, the odds are stacked squarely against us.
Even in black jack, which has one of the best odds of all casino games (between 44% to 48%), we are still guaranteed to lose over the long haul.
Of course this doesn’t stop people from blowing thousands at black jack tables whilst guzzling down booze which is guaranteed to impair their ability to think objectively.
To see this in action, just walk into any luxury casino and understand that it was funded by a legion of losers.

Similarly in the markets many traders suffer from a chronic lack of understanding of some basic market statistics.
Let me enlighten you:
Markets spend roughly 66%, or 2/3rds of their time trading sideways
Markets spend roughly 22% of their time in bull trending phases
Markets spend roughly 11% of their time in bear trending phases
When markets are trending, they spend almost double the amount of time (22% vs. 11%) in bull market mode than in bear market mode.
So bull markets have 2:1 odds against bear markets over the long haul.
Now 2022 has taught a new generation of traders an age old lesson: bear markets tend to be violent and fast moving and should by no means be taken lightly.
But that does not change the odds: markets over the long haul will go up.
One of the things we cover in RPQ Academy is how you can easily tilt the odds in your favor by understanding simple statistics my 4 year old niece could grasp via a pretty infographic.
So here it is.
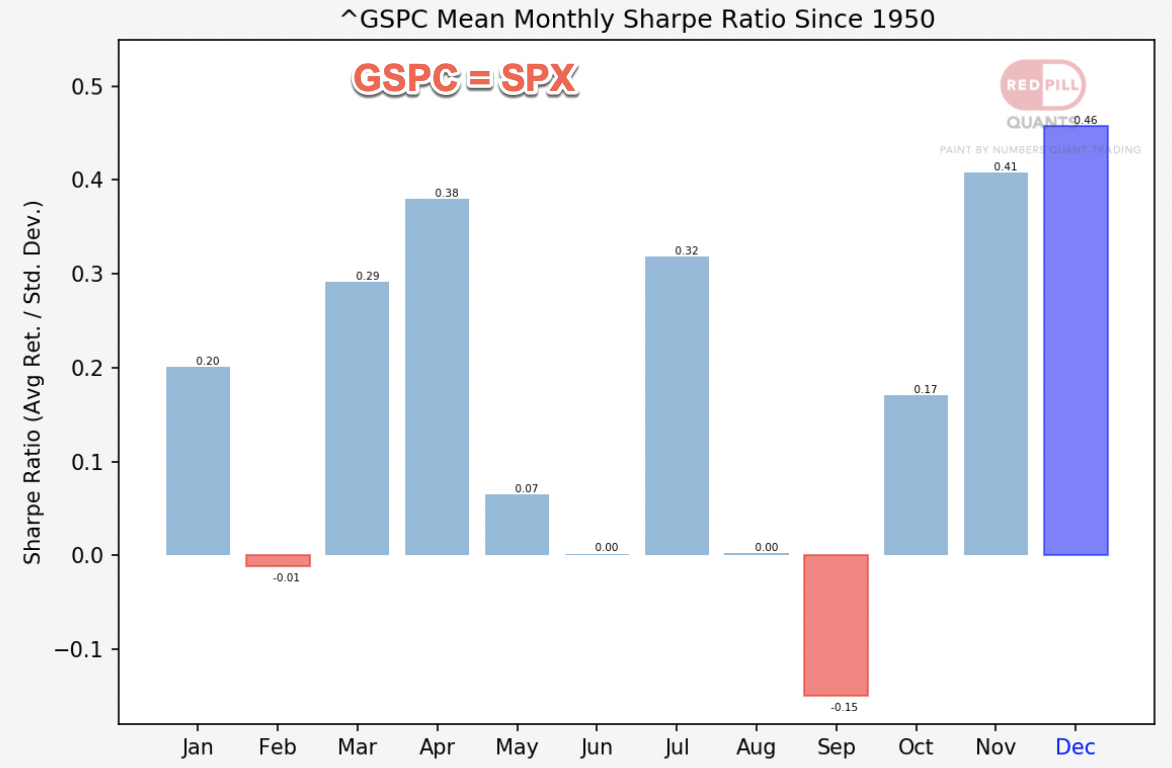
Turns out on average the S&P 500 has consistently been closing higher 10 months out of the year since 1950. Only exceptions – February and September.
Did you know that? If not – hey I don’t blame you.
Cause I myself didn’t know either until a few years ago.
So I reached out to a community of quant traders over on quantiopian (now defunct) to get my paws on detailed statistics on the SPX and all the stocks listed in it.
The collective response: crickets.
So here was a group of self professed quant traders and none of them had ever even considered to put together basic historical statistics on the stock market, let alone any single listing.
Me being me – I decided to sit down and build my own damn statistics parser, which I am now sharing with all my RPQ Unlimited members.
And now we all know when’s a good time to buy, when’s a good time to hold, and when’s a good time to sell. Which has helped us immensely in assessing the probability of our trades.
A lot of successful trading concepts are really ‘duh! Why didn’t I see that before?’ type of ah-ha moments once you understand them.
And that’s how we roll here at Red Pill Quants.
Chiseling away all the noise and mind trash that’s blocking your view on what truly moves the needle when it comes to successful long term trading and investing.
LIVE cumulative P&L of all my trades over the past year can be found here.
If you’re interested in joining as an Unlimited member at Red Pill Quants take advantage of our EYO super sale which offers a massive discount if you sign up for either six months or an entire year.
Or go month-to-month and decide later if you want to upgrade to a longer term membership.
See you on the other side.
Michael