I promised the Mrs. no work and no posts until January, but a situation has arisen that is worth breaking my promise and risking to invoke her holy wrath. Besides I already spend the past few days coding on a project – which to my shame is my definition of R&R these days. So I’ll better be quick as to not test my luck.
So what’s all the hoopla about? I won’t go into exhausting detail here but yes, it once again relates to implied volatility (my bread and butter). However this time the theme is a bit more exotic in that it has to do with the difference in premiums (and thus IV) between 30-day OTM calls and OTM puts.
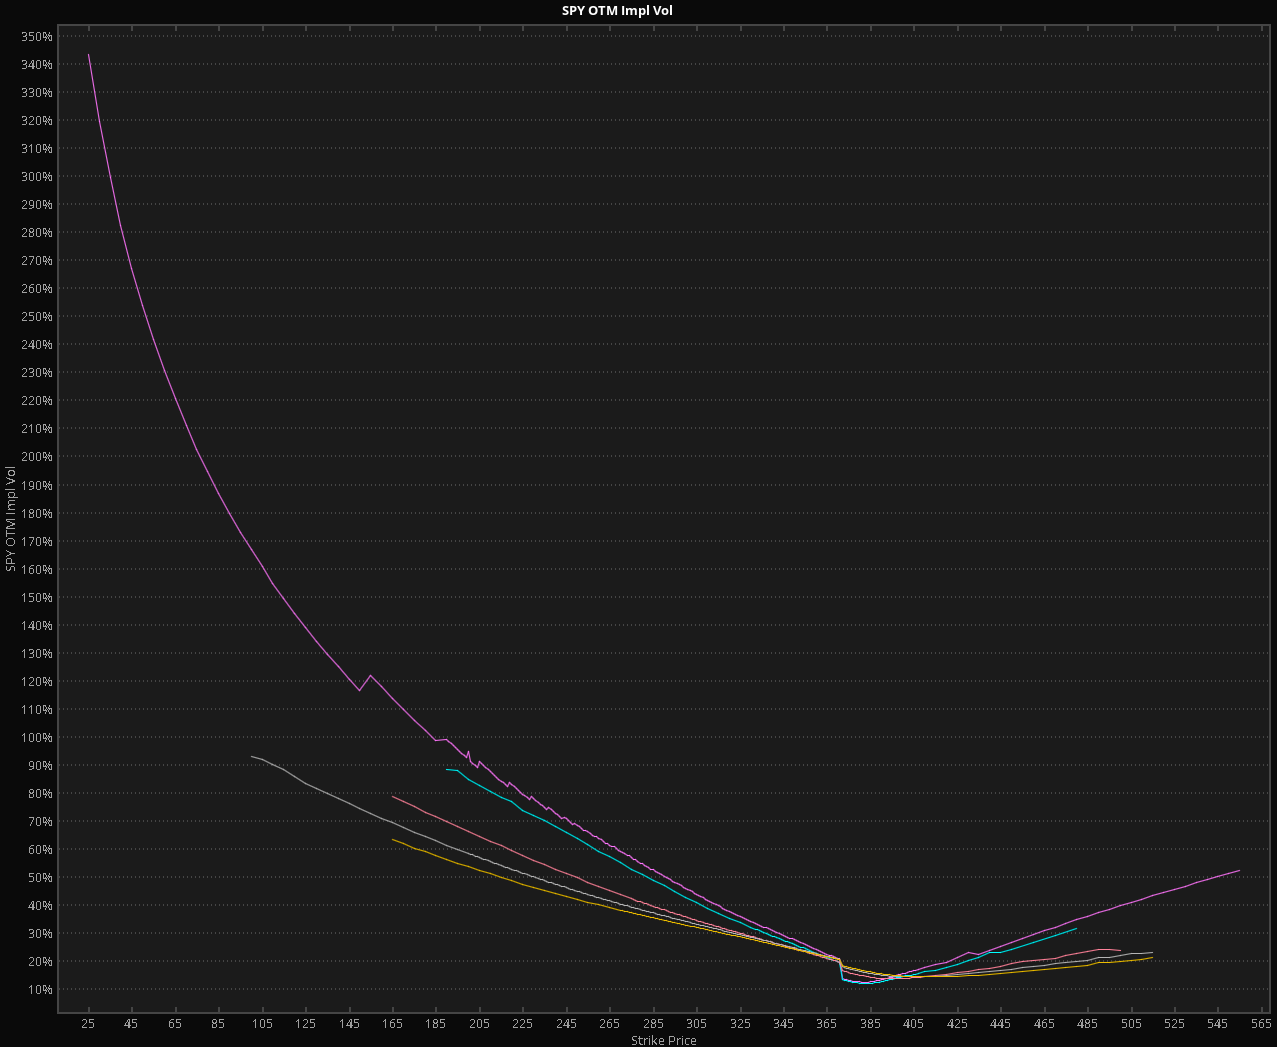
Otherwise known as SKEW (or the option smile) – and it’s nicely shown on the chart above which features the SPY January 15 series as well as a few others further out. But it’s the long line on top that I’m referring to and if you’re exposed right now then that’s the one you should be concerned about.
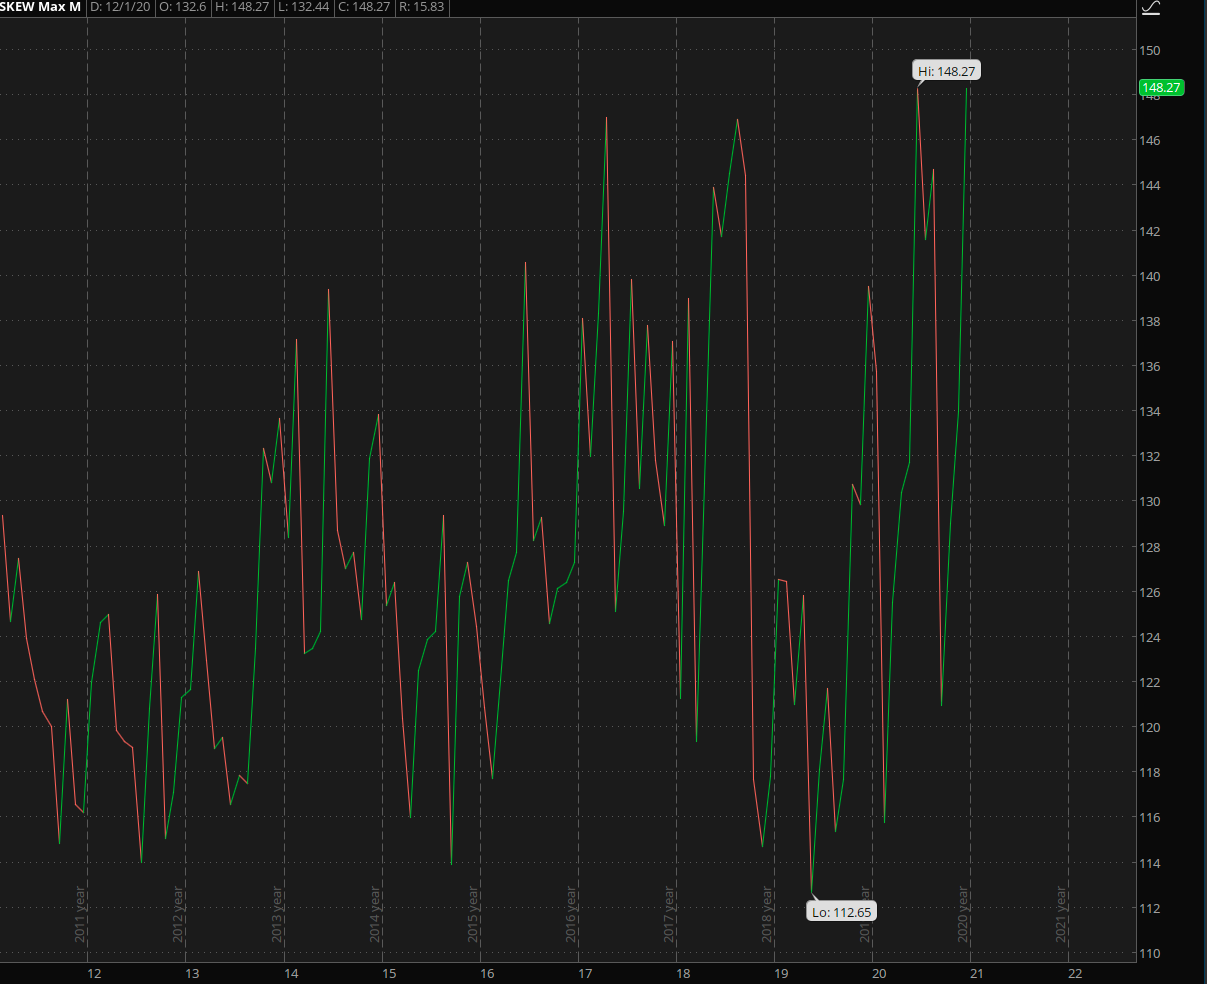
While the option smile shows you what’s going on right now it’s the historical SKEW graph that puts it all into long term context. And I don’t think that this one requires much in terms of explanation.
Clearly the current SKEW readings are ‘off the chart’ historically speaking. TOS only shows it back to 2011 but having tracked SKEW for a long time now let me assure you that we are looking at extreme IV deltas between comparable calls and puts right now.
If all that sounds like garbled Chinese to you then let me explain it another way: Let’s say you want to buy a straddle in the Spiders with contracts let’s say 5 strikes OTM. At the current time buying the put will set you back a lot more than buying the call.
It’s pretty normal for IV to be higher on the put side of the chain but as you can see in the graph above, it’s not a static value and it varies along with the perception of risk.
Given that and the fact that the SPX is trading at historic highs a bit downside protection going into January may be good medicine. This may be as easy as buying a few cheap OTM spreads or if you are more skilled an ATM put ratio spread is another possibility.
There is a slightly more advanced construct I call ‘the hammock’ which I have shared with my subscribers over the course of the past weeks [1][2][3]. It gives you the added advantage of being prepared for the possibility of a ‘blow off top’, which would not be unusual given all the free Fed money that’s about to be unleashed.
And that would be all for 2020 – time for me to close the books.
Here is me wishing you a great slide into what will hopefully be a better and prosperous new year.
See you all on January 4th.