The majority of traders fail for a variety of reasons but one of the biggest is that they keep asking the wrong questions. It’s not that the majority of them are stupid or untalented – I frankly don’t consider myself a genius either. It’s just that their head has been filled with years and sometimes decades of mental trash they seem unable to get rid of.
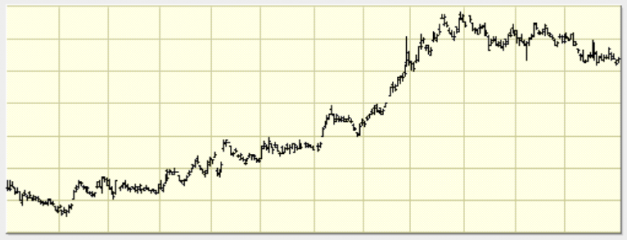
Let me give you a prime example. One of my readers posted this chart yesterday (it’s the TNX) along with a question:
“Is this chart bullish or bearish?”
See what’s happening there? Quite honestly there’s so much going on I could write three posts about this. But let me just pick out the most salient hang-ups.
First up it’s a loaded question. Meaning you are given a binary choice of bullish vs. bearish.
How about sideways?
Because looking at this chart that seems to be the prevalent ‘direction’ that comes to mind.
Which brings me to the next culprit. Predicting the future. The worst cognitive mind fu…k of them all.
I’ve run my trading blog for nearly 13 years now and convincing retail traders to refrain from predicting price direction continues to be the bane of my existence.
It’s like a rash on your backside that’s impervious to all known antibiotics.
Just to be clear: There’s nothing wrong with going long a bull market. Like there is nothing wrong at all with being short a bear market.
But for some mysterious reason retail traders seem to have an inherent obsession with predicting major changes in market direction.
When the market goes up they want to see it go down. And when it’s going down they want to know when it’s turning up again.
In sideways market they’ll of course do both, which is what makes range bound tape particularly juicy for market makers as they get to sell skewed OTM premiums to retail traders.
And why do retail traders continue to fall for the very same traps?
Because in evolutionary terms we are all nothing but silly monkeys who like to believe that we are in control of our environment and our destiny.
So when something isn’t going according to our wishes then we like to take action and bend reality in our favor.
Which is fine if you want to avoid freezing to death or not getting eaten by that lion outside your cave. But it does eff all when it comes to things completely out of your control, like for instance the stock market.
And that brings me to the final mental quirk: Attempting to interpret price action during an information vacuum.
One of the hardest lessons to learn for retail traders is that there are times when the market does not produce sufficient clues to afford you an edge worth basing any trades on.
So what is a trader to do? Just do nothing?
Actually that’s a brilliant idea. When the market is not conducive to your style of trading then the best course of action is to simply do nothing.
Which is very very hard to do for most people. Silly monkeys have some merits – we did conquer the planet after all – but sitting still and not doing anything isn’t one of them.
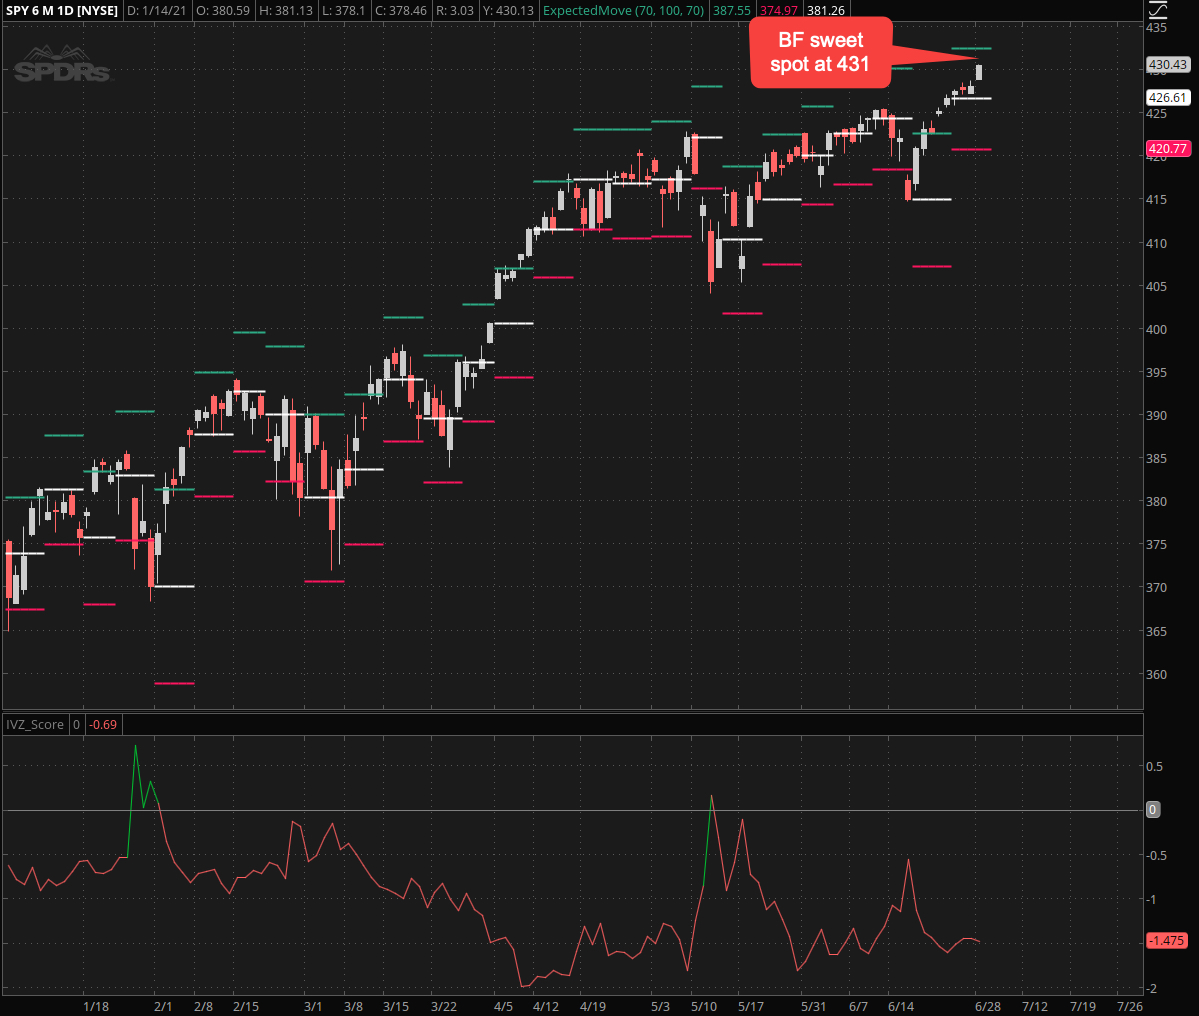
With that in mind let’s look at the SPY campaign I posted on Monday. After nearly two months of sideways tape we finally saw a push outside the dreaded 30 handle range we had been trapped in since early April.
At that time continuation higher or a reversal with a retest had the highest odds, especially given that it’s summer.
Instead of making a bet on direction I did what very few traders ever do: Pop open the hood and look at the engine.
And right away what stood out to me in particular was the fact that the expected move for this week was pinned at roughly 47 SPX handles.
That after a 120 handle advance the week prior. So clearly directional risk – in either direction – was not being handicapped properly. At least that was the hypothesis.
So what did I do about it? Simple – I took out two butterflies, one centered around SPY 431 and the other around SPY 423.
As you can see the bullish side won and based on the ES futures as of this writing I may be able to close out the bullish BF near max profits.
So that’s great and our nefarious plan seems to have paid off. But only because the expected move on the SPY appeared to have been under estimated.
There are actually much better vehicles for trading EM right now.
And for that look no further than the XLE, which seems to have a magnet attached to its rearside as it keeps touching at least one of its EM thresholds almost every single week. Sometimes even twice.
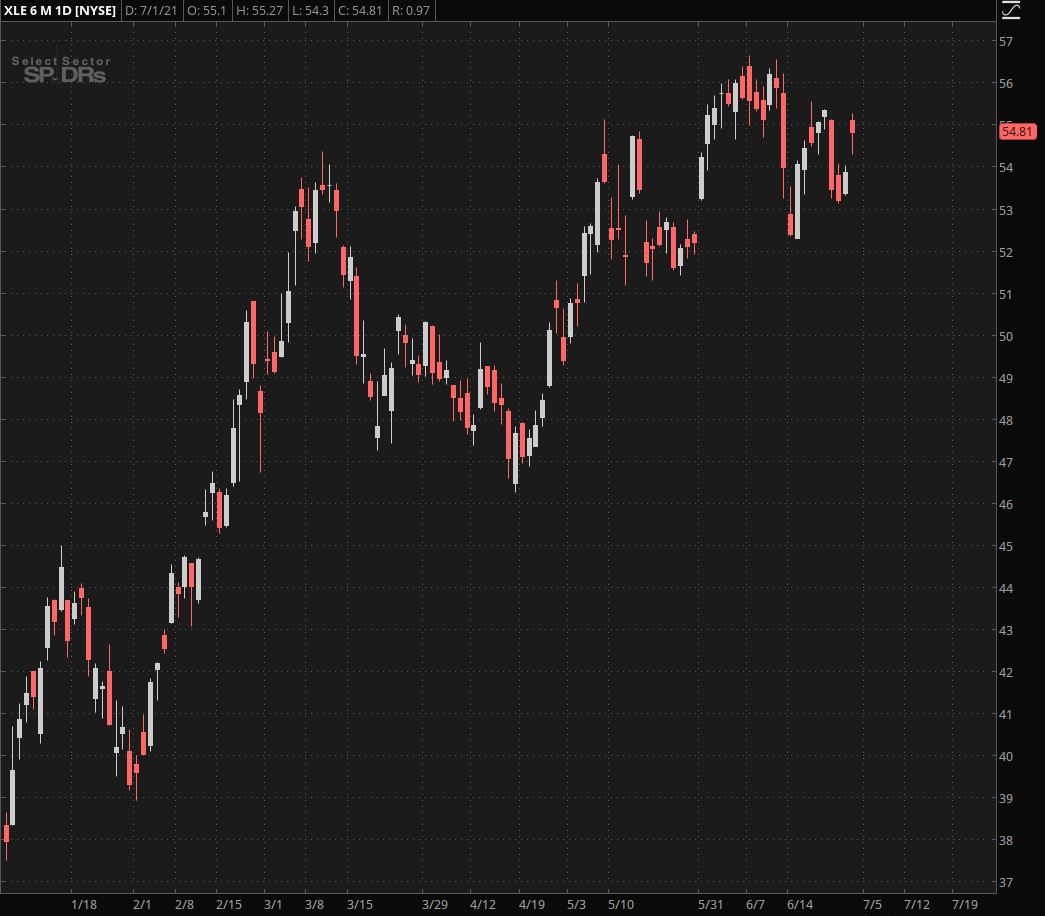
Speaking of the XLE – let me show you something very cool. Let’s drop all the fancy indicators and just focus on price.
Do you see what I see?
Yes it’s going up, but that’s not what I’m looking at.
This is what I’m looking at. There is a lot going on here, if you know where to look.
First up it’s clear that the XLE has a tendency to gap the open during trending periods.
So when you see large or even small micro gaps then you know the trend is intact.
However as soon as you see overlapping candles – even large ones – that is when you need to start paying attention.
But not so fast – instead of predicting the direction it’ll take next all you need to do is for price to show you where it wants to go.
A very simple way of doing that is to pick the previous spike high or spike low and use that as your entry threshold.
From there you simply jump on the bandwagon as soon as one of your thresholds has been breached and Bob’s your uncle.
By the way all of this and more is explained in much detail in my most excellent Price Action Masterclass which you can find in the Red Pill Quants Academy section.
Assuming of course you are a member of course, so don’t dillydally and sign up right now to access to the full Monty – all courses in my library including the Price Action Class.
Happy 4th of July!


