Just last Friday I was pointing out that the VIX was still too damn high. It’s rather obvious that with trillions in Dollars added to the federal balance sheet in just over the past two years, a two front war on the horizon, the global supply chain in tatters, de-dollarization picking up steam across the global South, credit markets facing a wave of defaults, inflation on the rise and growing steadily, plus more bank failures looming ahead, we should clearly be seeing the VIX at single digits at this point.

Spoiler alert: Both my post and intro above were meant to be cynical, but true to form the market quickly responded by dropping the VIX all the way down to 14.
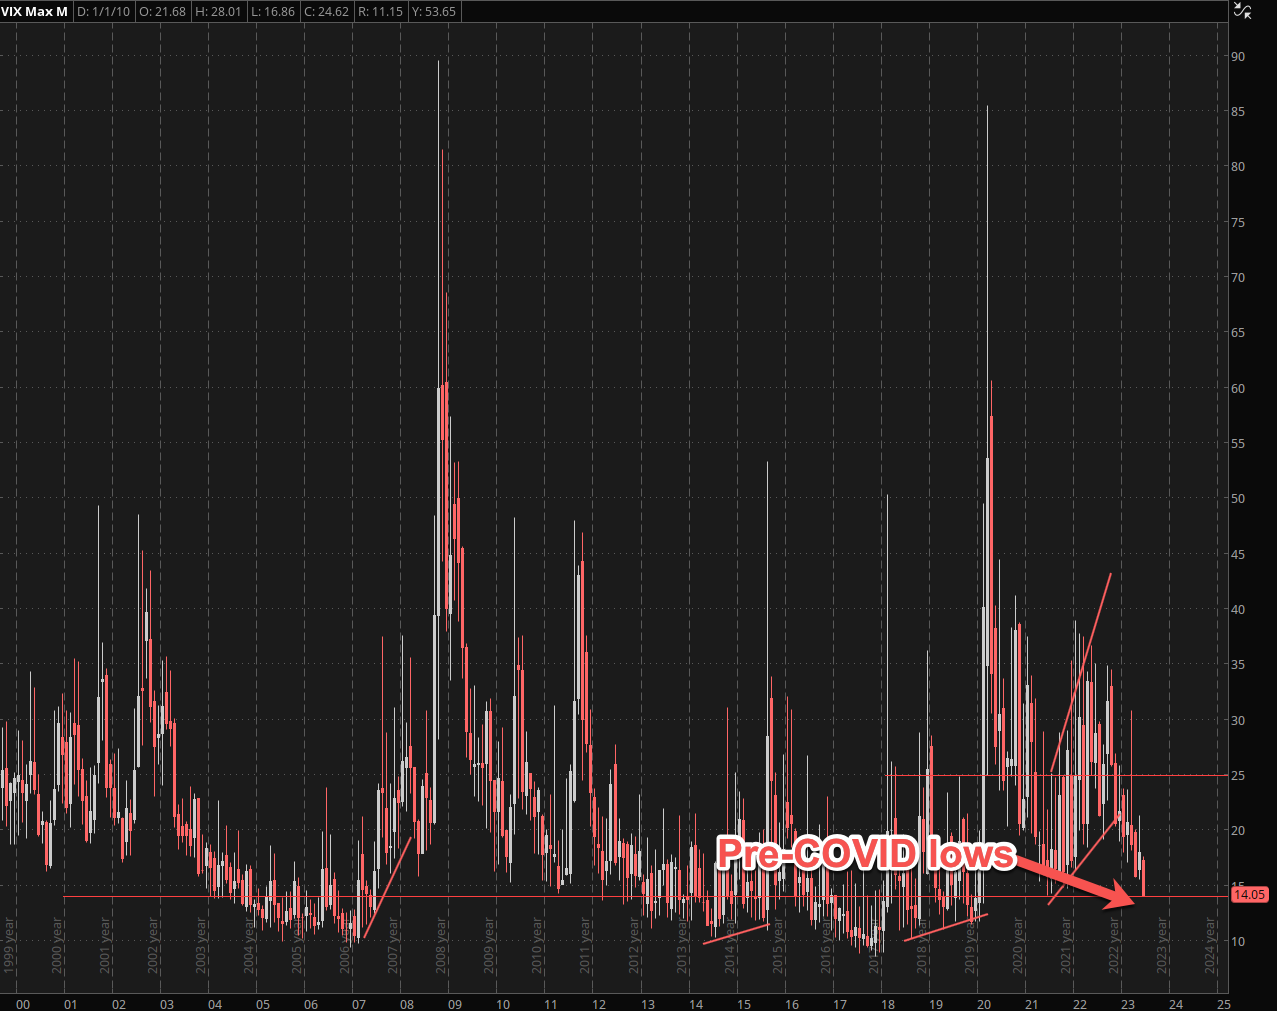
I frankly thought I had seen it all at this point, but this move surprised even this crusty old market maven.
For a bit of context, the last time the market enjoyed bottom barrel IV readings like these (i.e. 15 and below) was in the pre-COVID days.
Now some of you astute readers may wonder what a VIX of 14 actually means and why you should even care. So let me introduce you to the handy rule of 16 and it’ll all make sense.
Don’t worry, 4th grade math should be more than sufficient to get you through the next few paragraphs. However I recommend you pay close attention because this is really important.
First up when I talk about the number 16 and how it relates to the VIX, I should point out that it’s actually 15.87, which is the square root of 252 (the number of trading days in a year).
Rounding 15.87 to 16 is where the rule of 16 gets its name. So far good – no strained neurons reported just yet.
Okay so what the hell does it mean? According to the rule of 16, if the VIX is trading at 16 then the SPX is estimated to see average daily moves up or down of 1% (because 16/16 = 1).
And if the VIX is at 24, the expected daily moves should be around 1.5%, and at 32, the rule of 16 implies the SPX might see daily moves of 2%.
Easy peezy lemon squeezy.
Now that you’ve been awarded a PhD in quantitative finance you probably understand that if the VIX drops below 14 the market apparently expects the SPX to paint average daily moves of 0.88% (14/16 = 0.875).
And if you actually believe that is in any way realistic then I have a bridge in Kiev to sell you.
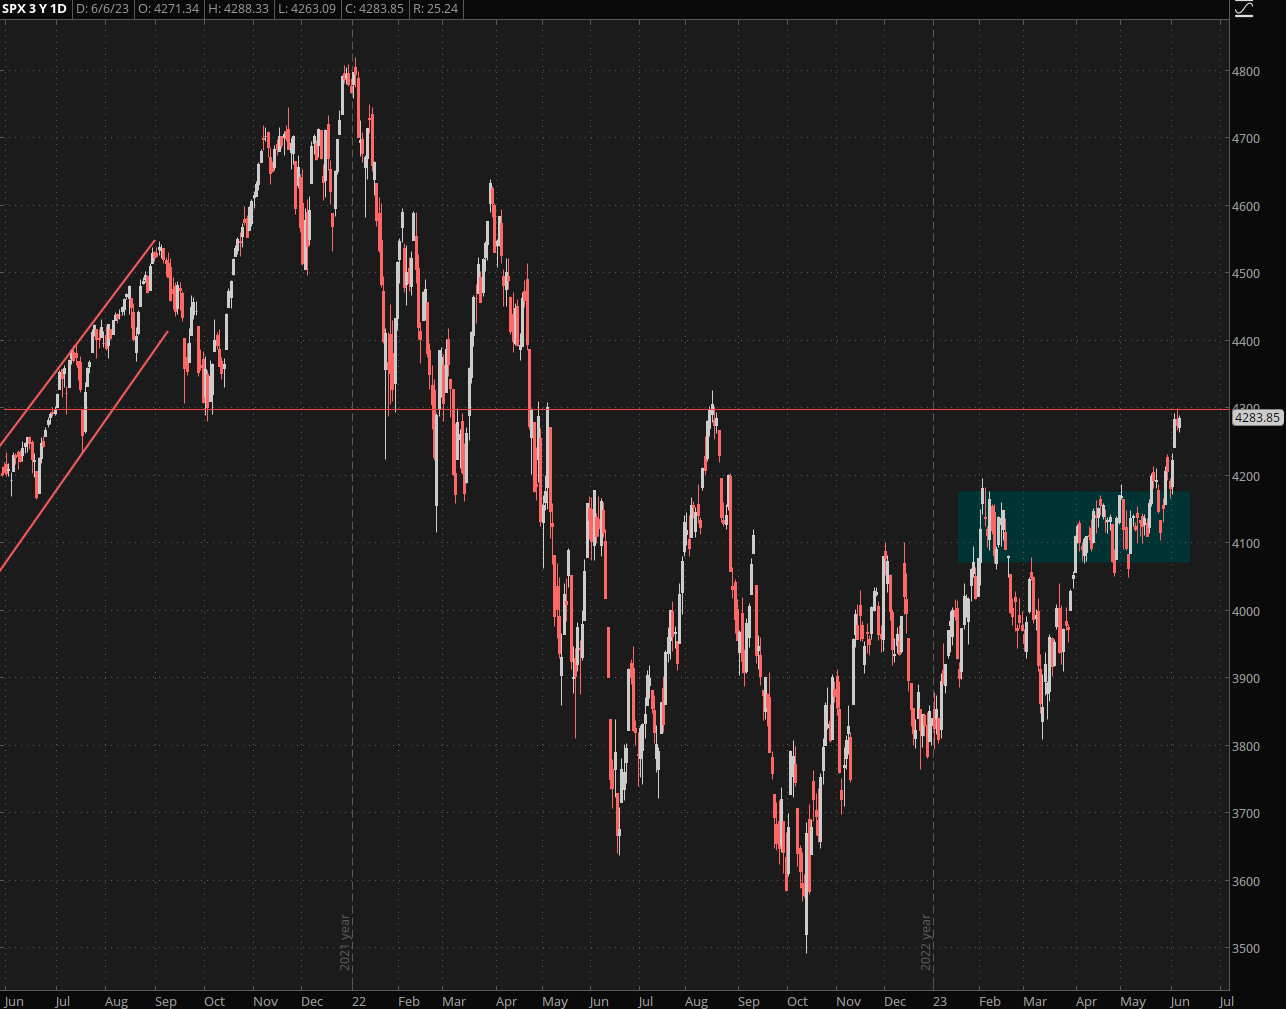
Looking at the SPX chart above, I sort of understand the irrational bullish exuberance that seems to have gripped market participants. We’re pinned against a major inflection point (i.e. SPX 4300) and breach here is expected to pump stocks even higher.
Before you back up the truck keep in mind the fact that only about 7 stocks are driving this entire advance:
Here are the top four: NVDIA, META. AMD, TSLA
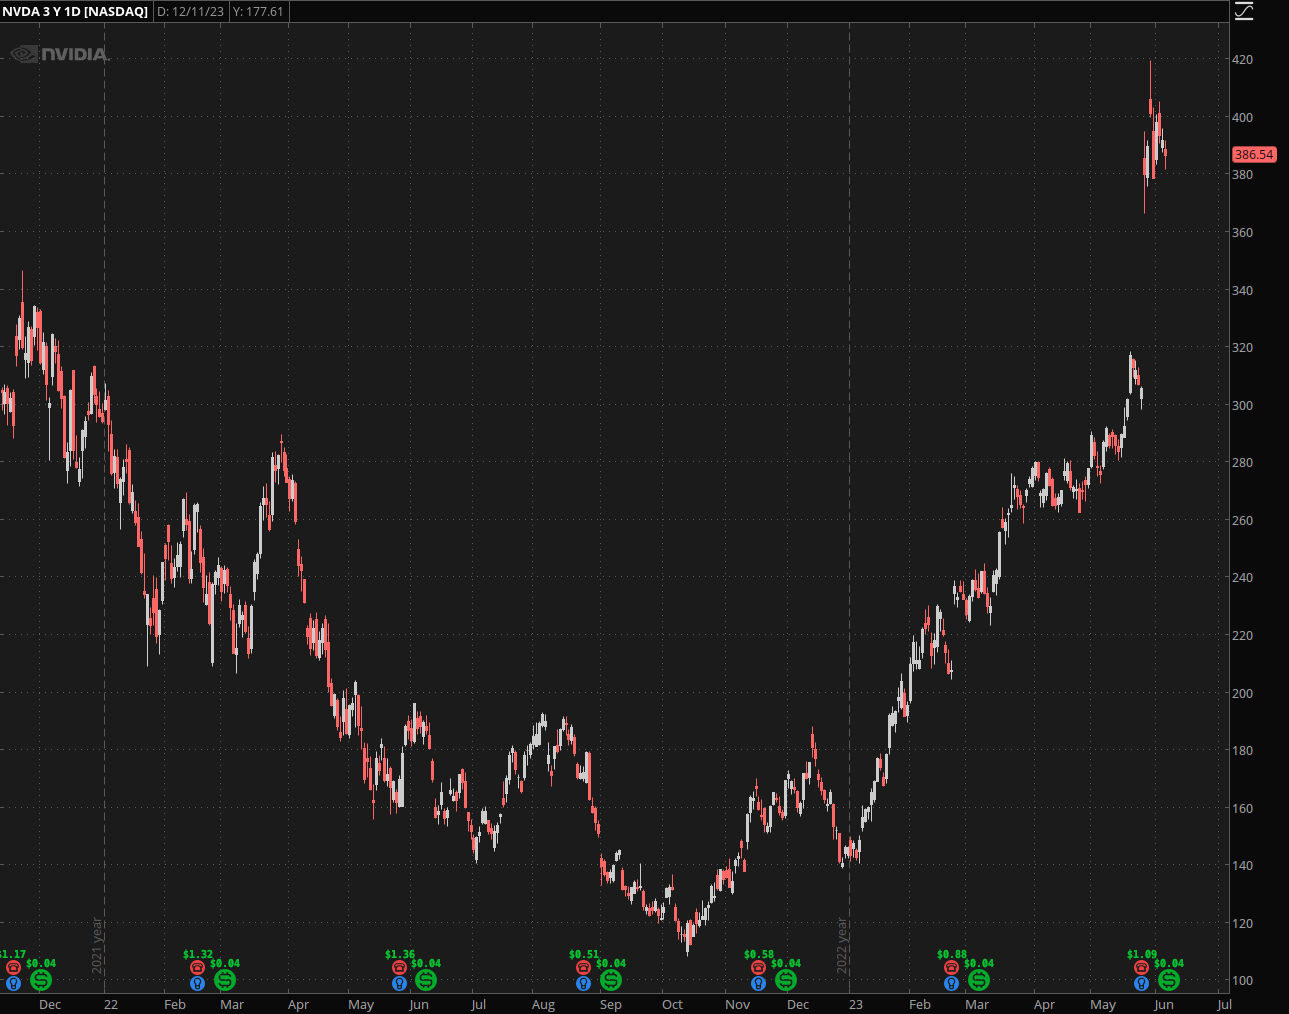
This massive advance in NVDIA despite the fact that graphic card sales are currently imploding.
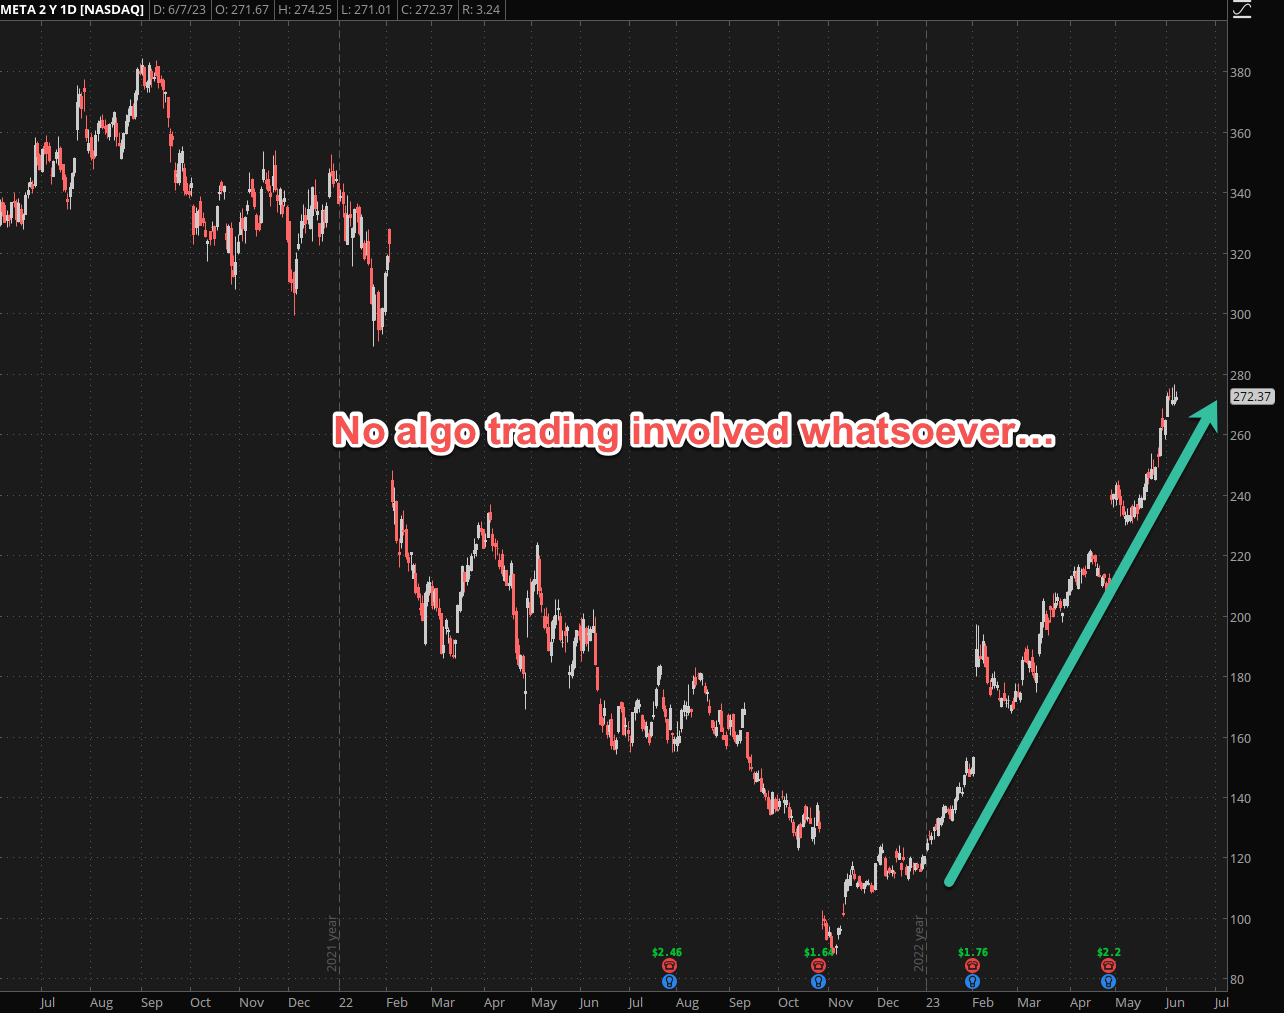
META recently reported strong earnings but the linear trajectory over the past six months borders the metaphysical.
Strangely however the most recent collective advance in equities is due to some good old fashioned sector rotation, the sort nobody in their right mind should have anticipated.
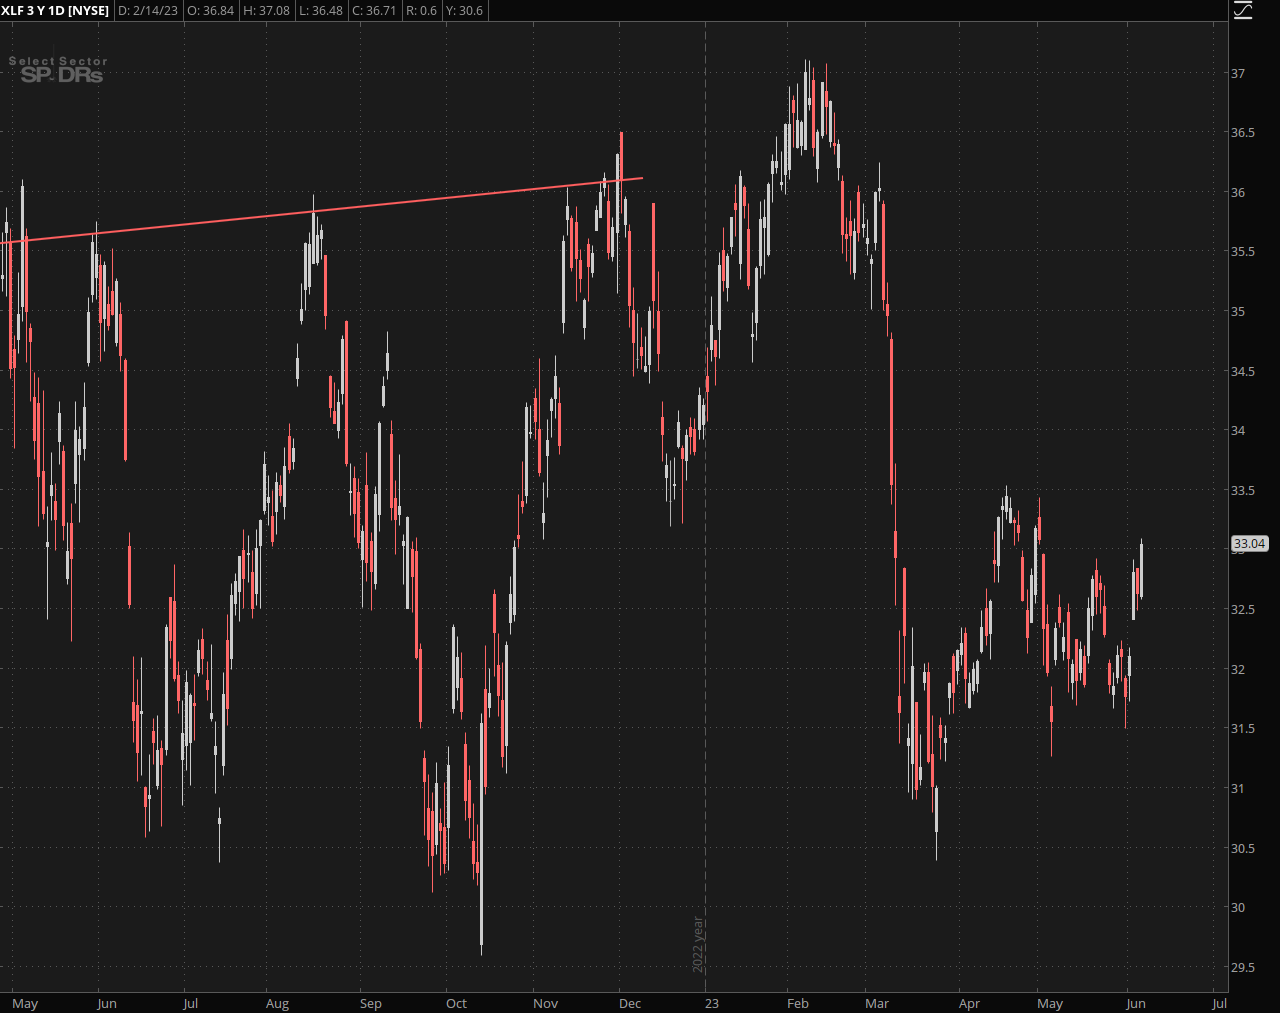
XLF is suddenly getting massive bids. Did I miss some important memo or something?
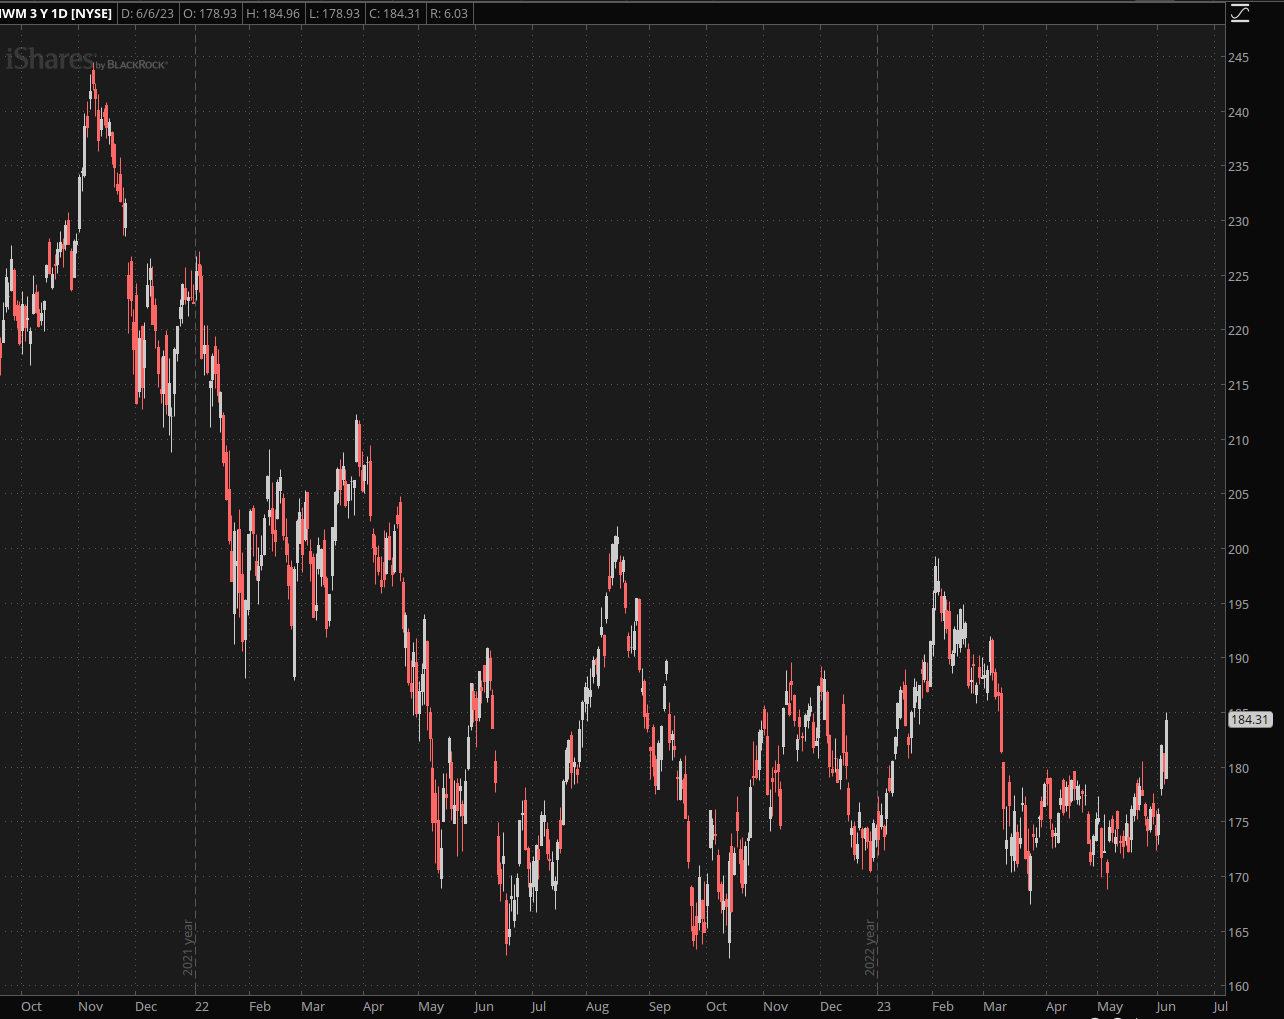
Also getting pumped now is the bubonic plague of all ETFs – the IWM. Who’s buying this stuff?
Recall that market breadth has been a mainstay of the recent advance in equities. I’m not one to ever argue with price but I’ve also been around the block long enough to suspect a bull trap of biblical proportions.
So what shall we do about it? Can we take advantage, and if so then when and how?
That’s what my next post is going to cover, so stay tuned for more.