With the futures down and falling ahead of the Monday open it’s time to take a look at important inflection points that will affect the medium term direction in equities and other correlated markets (crypto increasingly one of them). And as a trader it’s particularly important to determine when one’s bullish or bearish hypothesis meets its make or break point. Fortunately the market has left us with fairly clear clues as to where to ‘draw the line’ literally speaking:
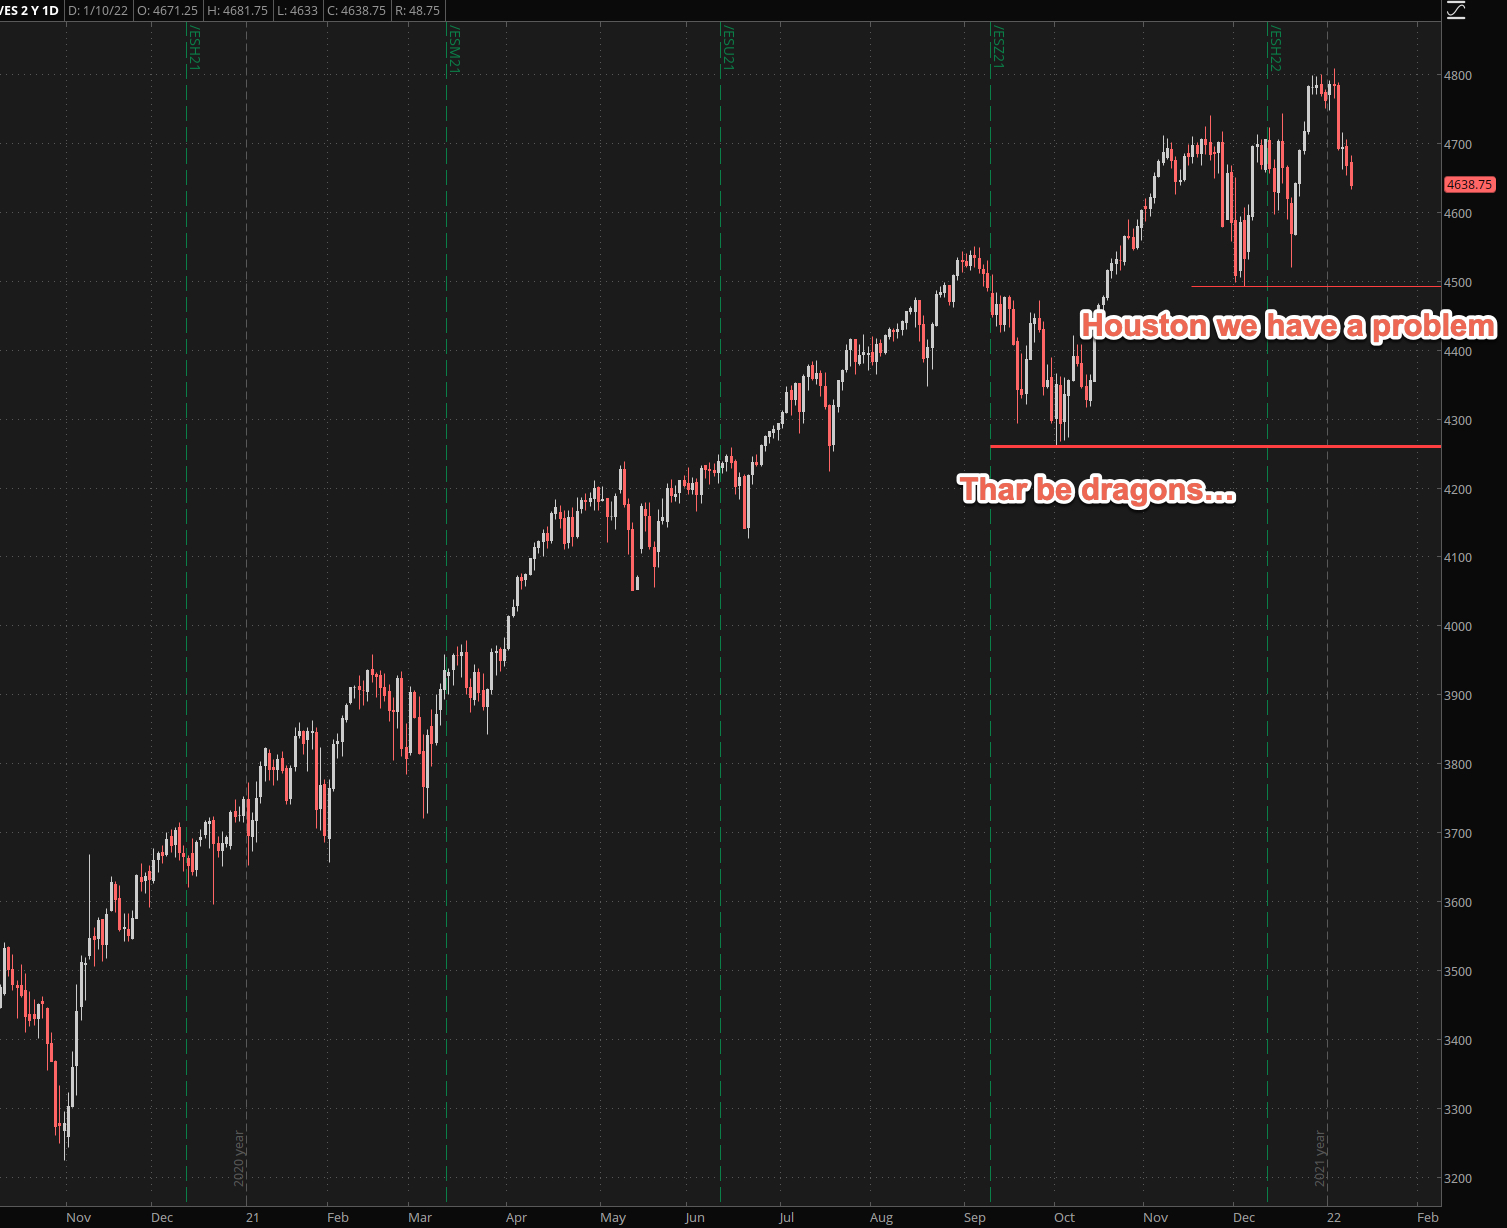
On the SPX (shown here are the S&P March futures) our first hurdle stands at 4500 and a close (not just a drop) below it would most likely trigger a boat load of stops and drag us lower toward SPX 4300 (it’s lower here due to fair value which is slightly below -9).
I am fairly certain dip buyers would defend that range at all cost as continuation lower would be catastrophic and quickly guide us lower several hundred handles.
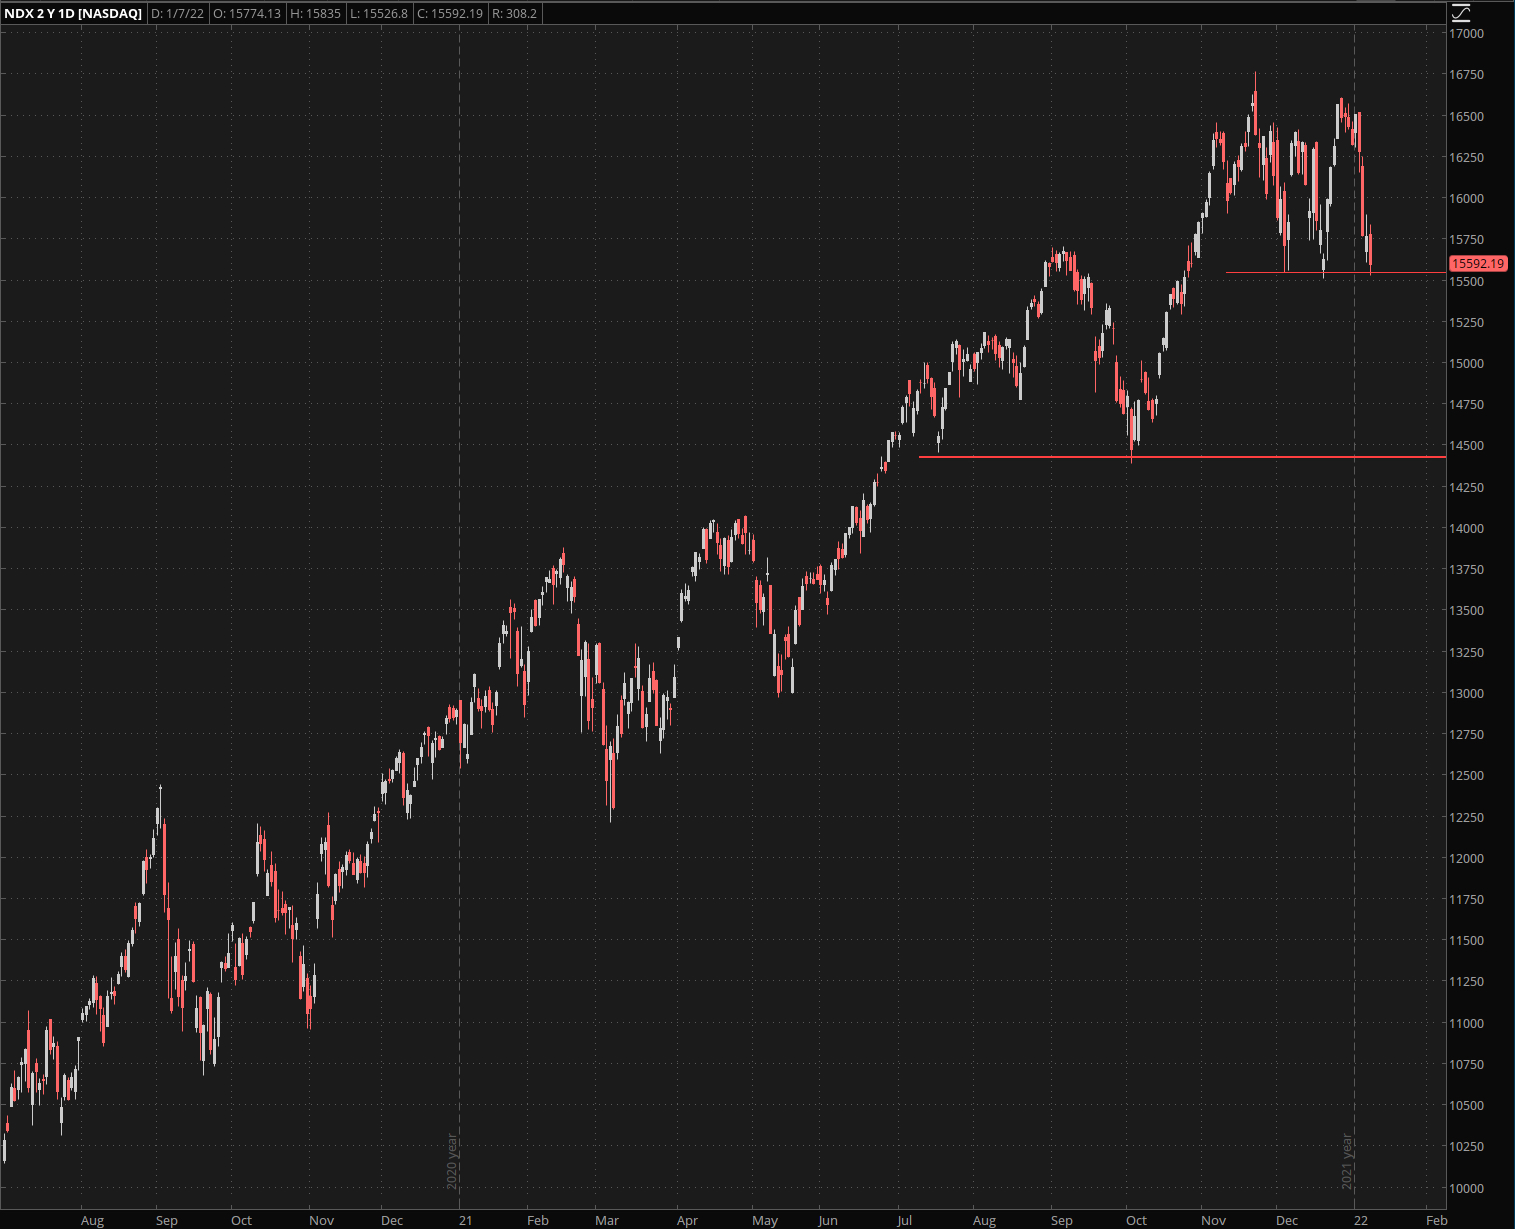
Tech is considerably weaker and if your stance is bearish I would be looking for short victims among big tech which is starting to suffer from interest rates woes.
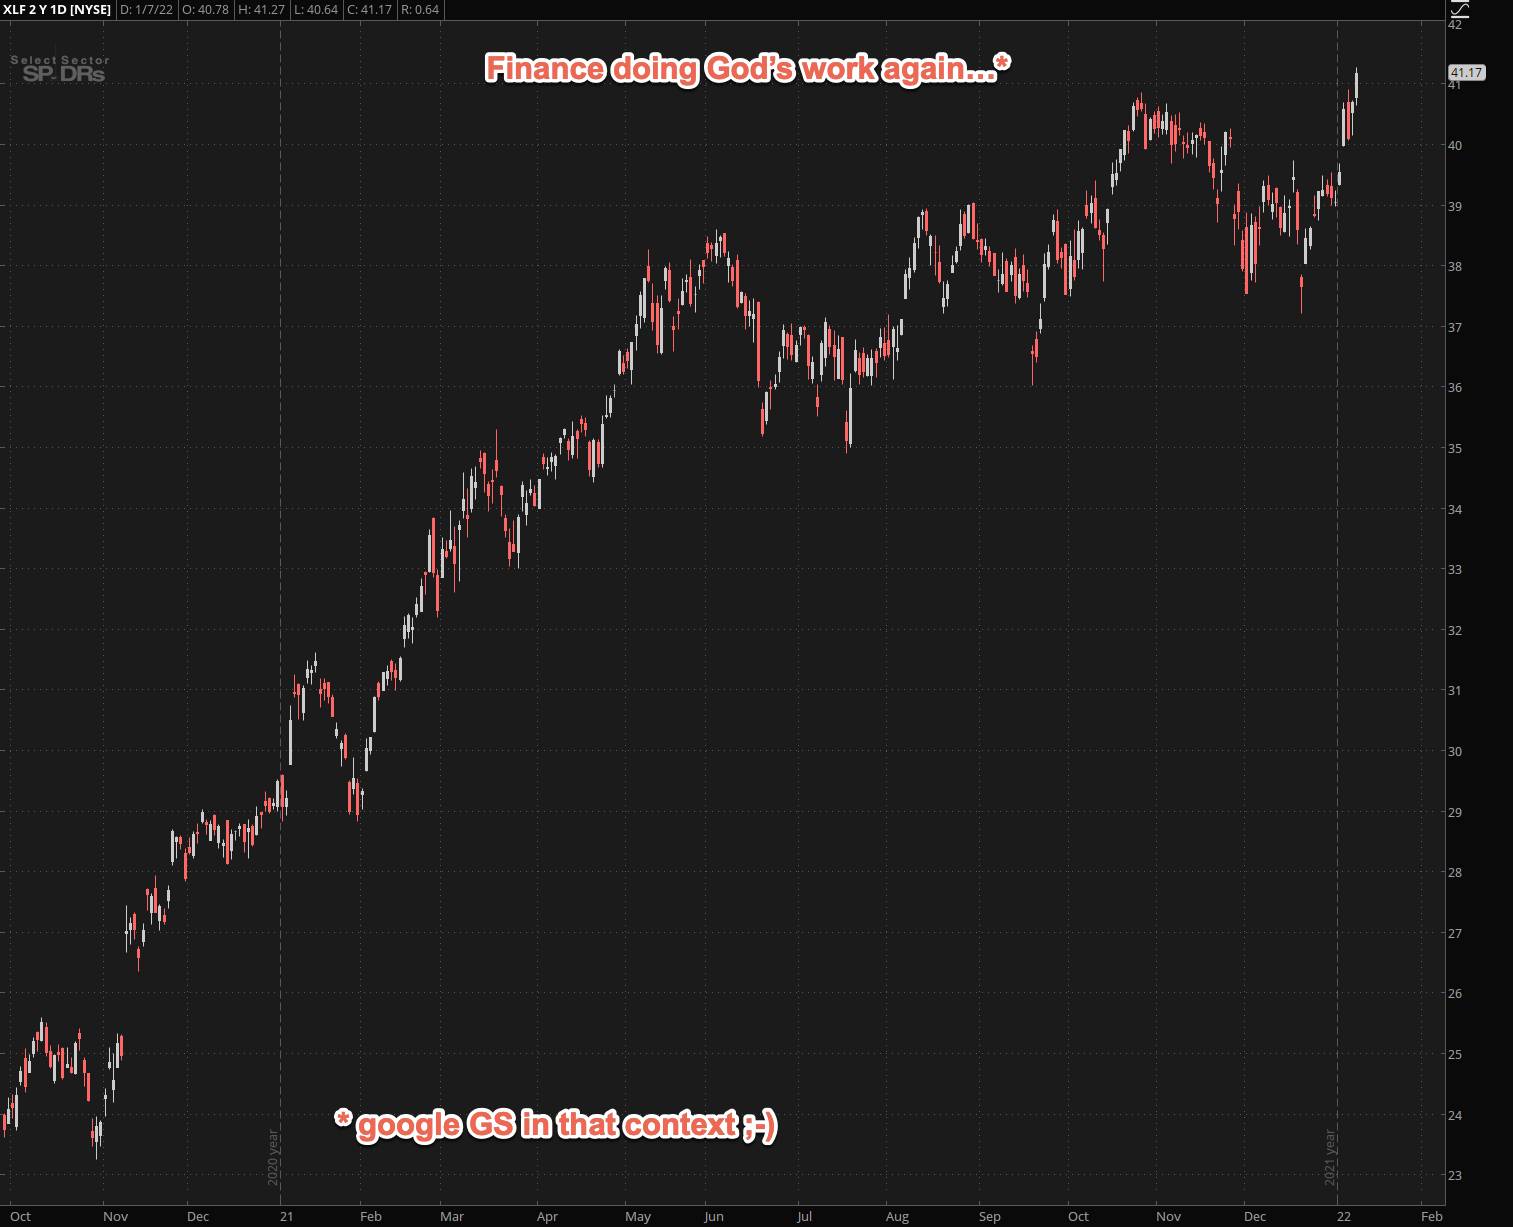
Meanwhile finance is doing ‘God’s work’ again and as far as I was able to gather this is the only bullish sector on the menu as of right now, outside of energy of course.
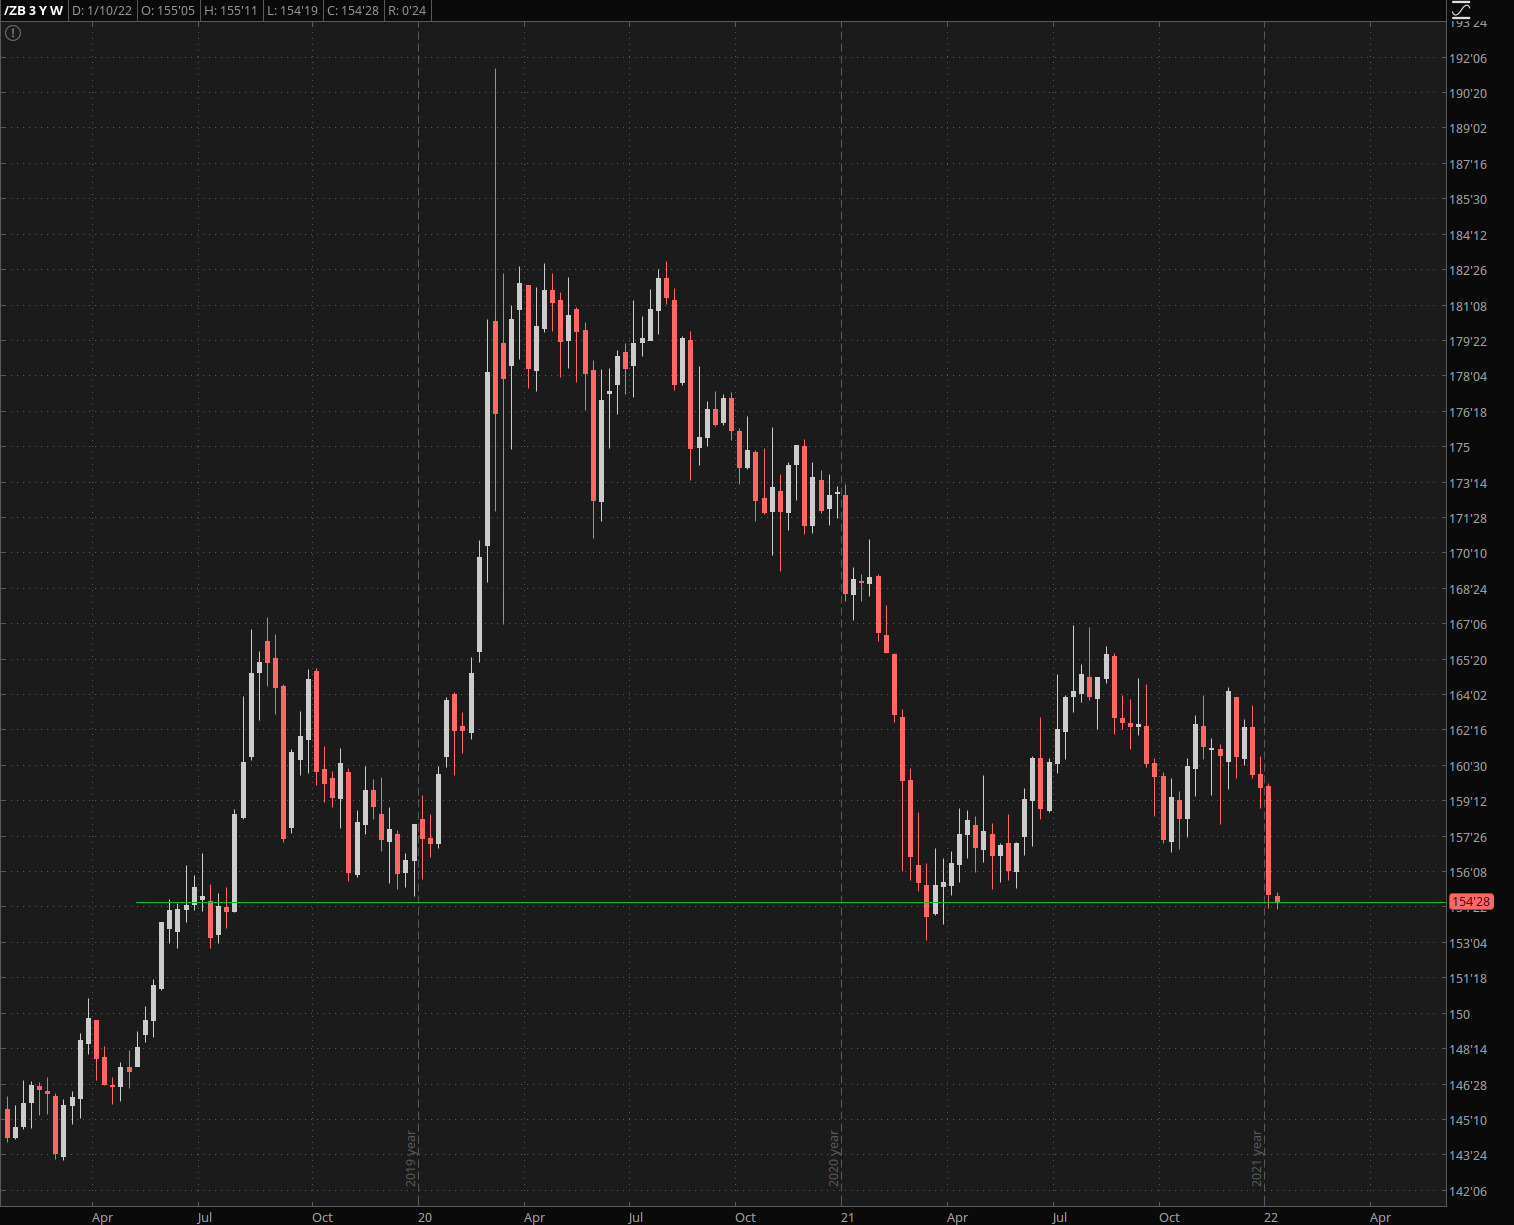
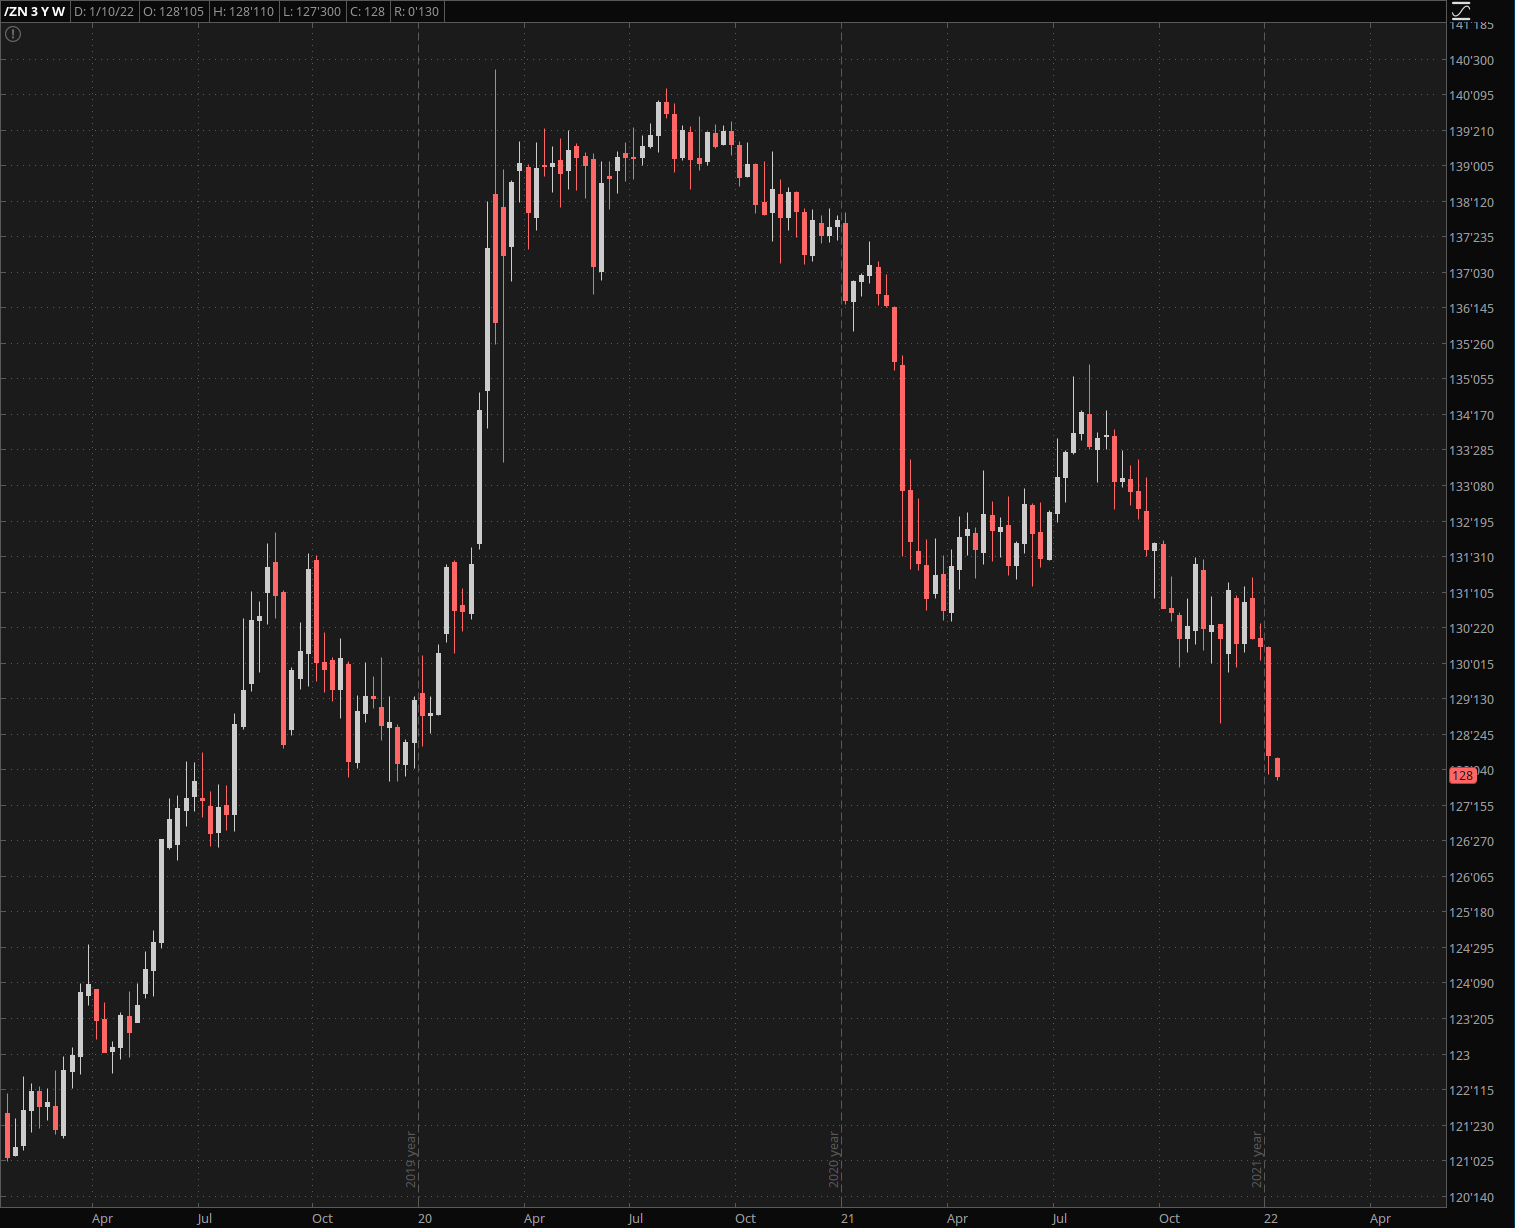
Note that the 30-year bond futures have fallen to long term support.
As have the 10-year futures which does affect interest rates quite a bit more and it explains why big tech is increasingly suffering.
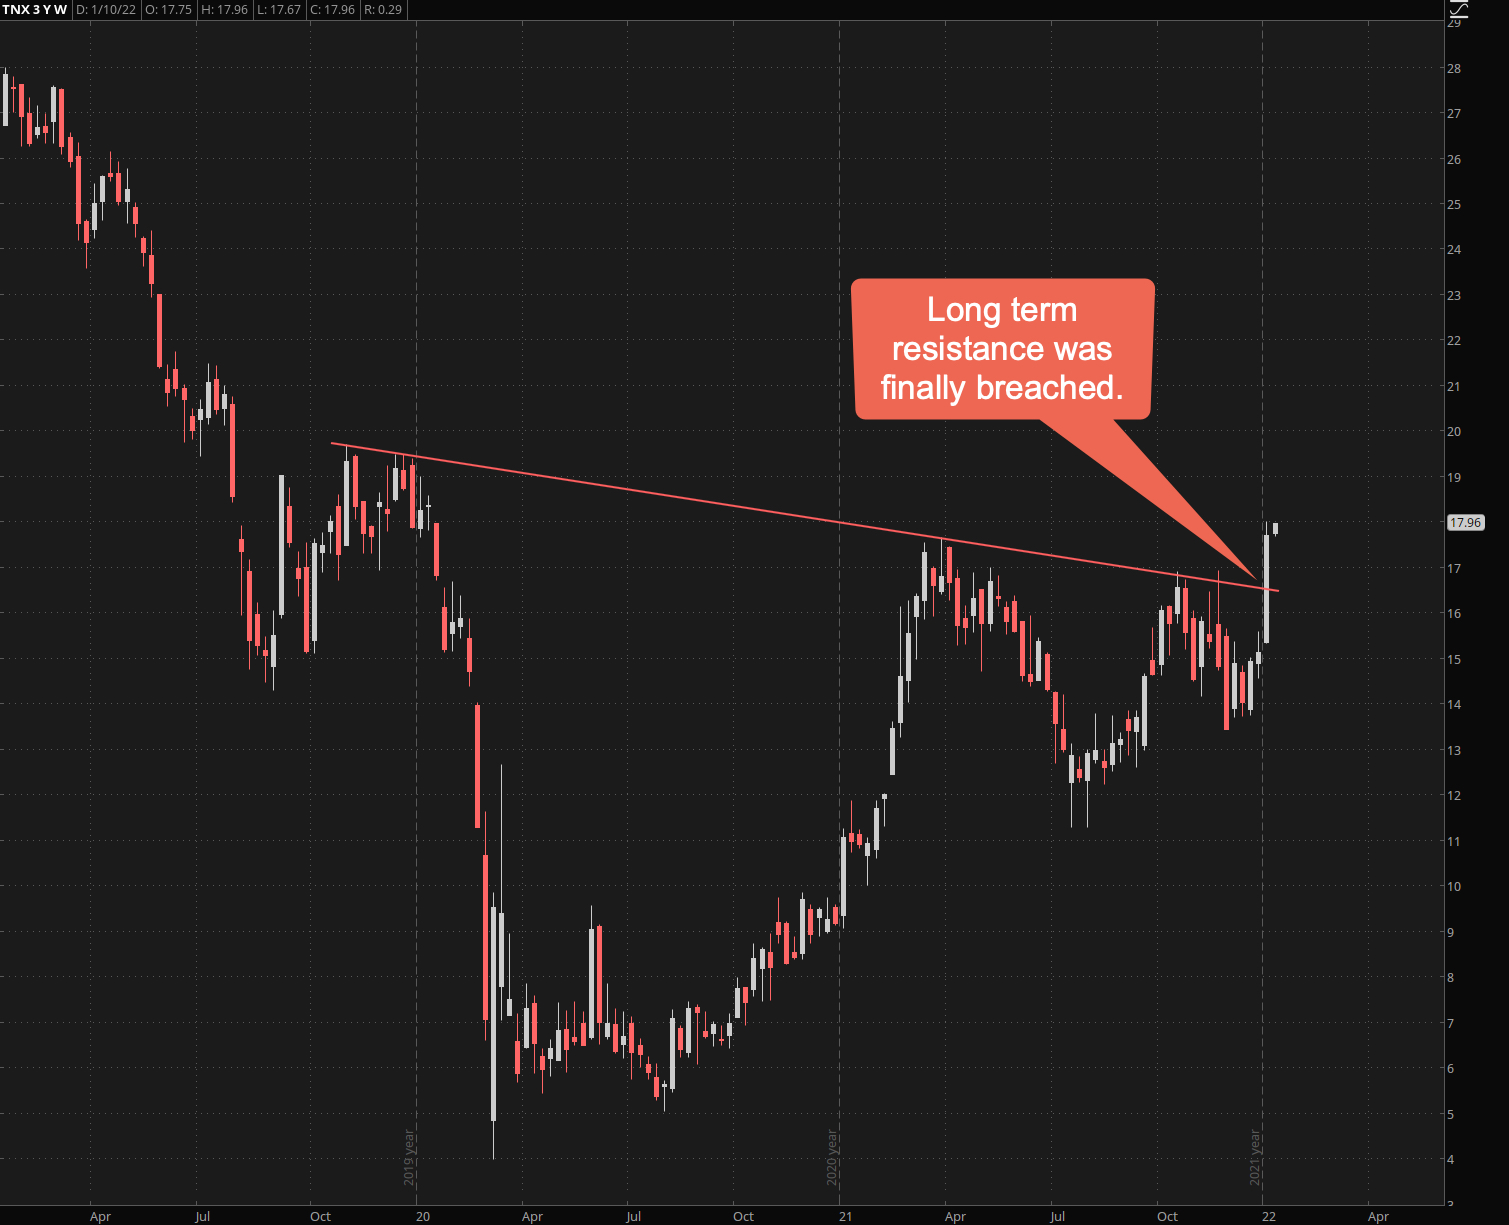
Here we are observing the inverse scenario as long term resistance has finally given way. I would even pose that the TNX is slightly leading the ZN.
If this trend continues we could be seeing a massive correction in big tech symbols sometime this quarter.
Please log in to your RPQ membership in order to view the rest of this post. Not a member yet? Click here to learn more about how Red Pill Quants can help you advance your trading to the next level.

