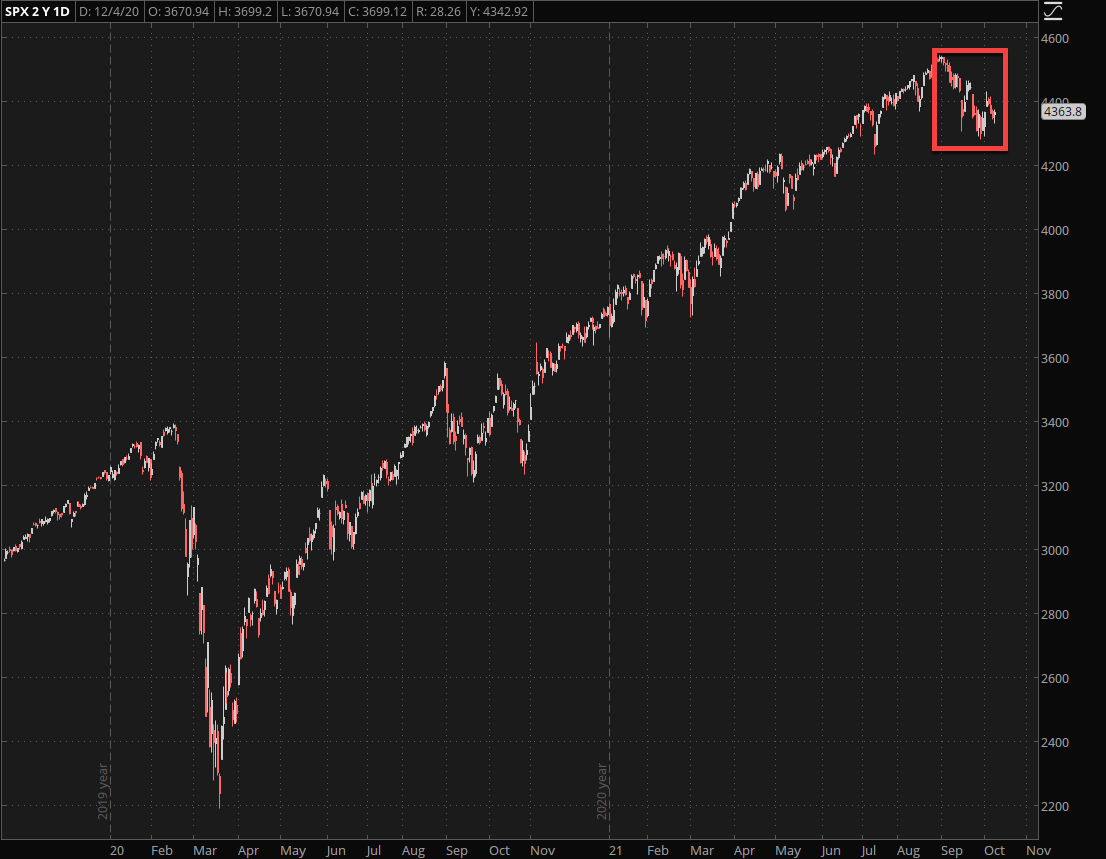
I caught the SPX on a longer term panel today and a few things immediately stood out to me. First up we are most definitely in a corrective phase, which is obvious simply by looking at the chart. No indicators or quant magic needed.
Many traders become lost in the ‘fog of war’ produced by short term panels. The longer term view often speaks loud and clear without lagging abstractions such as indicators.
The only other period that sort of resembles what is going on right now is the late summer season of 2020, which of course was preceding the presidential elections.
The next thing that caught my attention loosely relates to implied volatility, which as you may recall has remained in steep contango across the entire VX futures chain.
On the price panel the auto-EM ranges continue to be observed which is pretty damn bullish despite all those scary red candles.
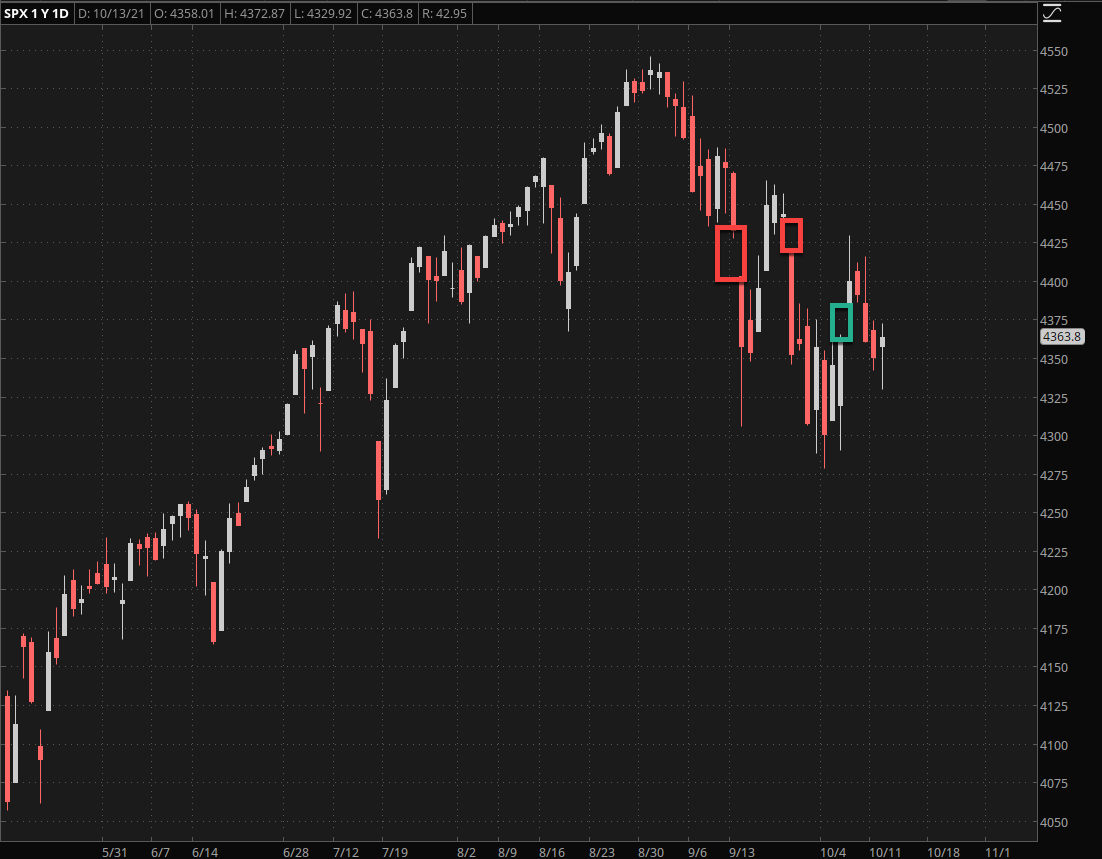
If we zoom in a little what clearly stand out are large opening gaps – two to the downside and one more recently to the upside. There was a little retrace which now appears to be in the process of being recovered (not on this chart as it’s in the new session).
This actually makes our job fairly easy:
- The current gyrations represent a tug-o-war between bearish and bullish forces. As usual since the onset of QE and bond purchases back in 2009 the bears find themselves at a disadvantage, despite seasonality being clearly in their favor.
- A breach of SPX 4425 most likely leads us above 4475 and given that we should see a run for new highs.
- A drop below 4275 is fairly unlikely given the current price action but should it happen we’ll drop to periscope depth at around the 4000 mark. Again the odds of that are 30% if that.


