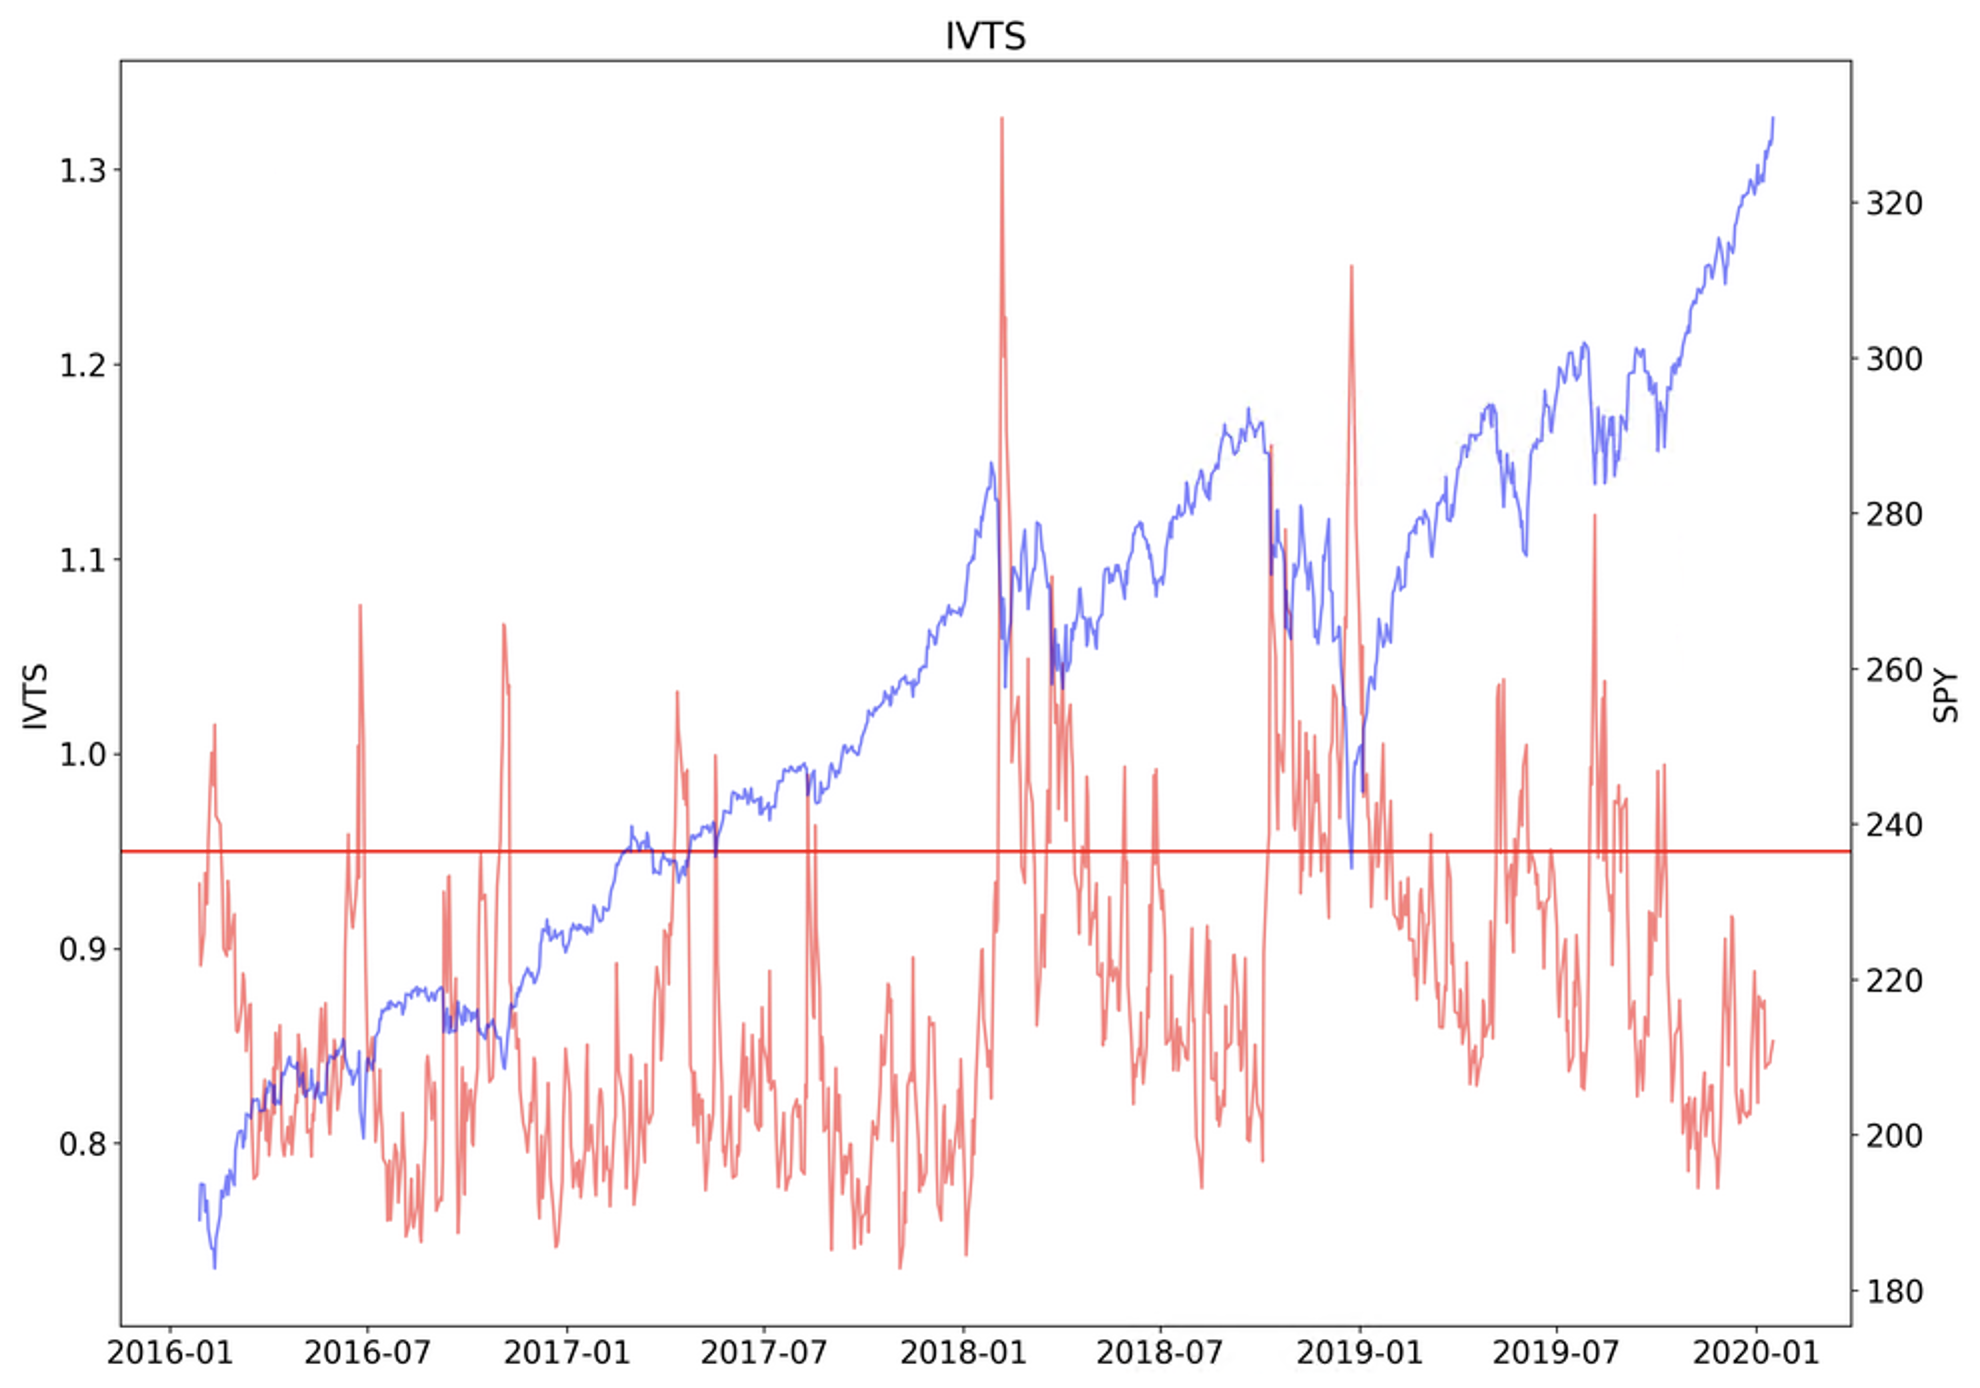
What is the IVTS?
The IVTS, or [I]mplied [V]olatility [T]erm [S]tructure, is a metric used by many trading professionals to gauge market conditions. That sounds like a mouthful of geeky stuff and although it sounds complicated, using it is super simple. So simple that at first, some traders have trouble accepting it's eloquence.
Eloquence is the art of conveying a lot without saying much. In the world of trading, the IVTS is about as eloquent as it gets. IVTS distills a lot of information into a simple number that we can use to determine what types of market we're dealing with right now. More importantly, what type of trades we should be taking.
Before we dive into how the IVTS works, understanding how it's calculated will help understand the mechanics of it. The IVTS is simply the ratio of the VIX over the 3 month VIX value (formally known as the VXV and changed by the CBOE to VIX3M in September 2017):
The VIX, VIX3M and IVTS
The VIX is the implied volatility calculated by the CBOE using a basket of options that have an average expiration of 30 days from the current date. The options used in the calculation are out-of-the-money calls and puts with an average expiration of 30 days. Only calls and puts that have an expiration between 23 and 37 days are used in the VIX calculation.
Normal values for the VIX range between 10-20 but can go much higher during vicious market downturns. And in extreme conditions of slow upward grinds of low volatility bull markets, it can dip below 9, such as during the quiet bull market in the summer of 2017.
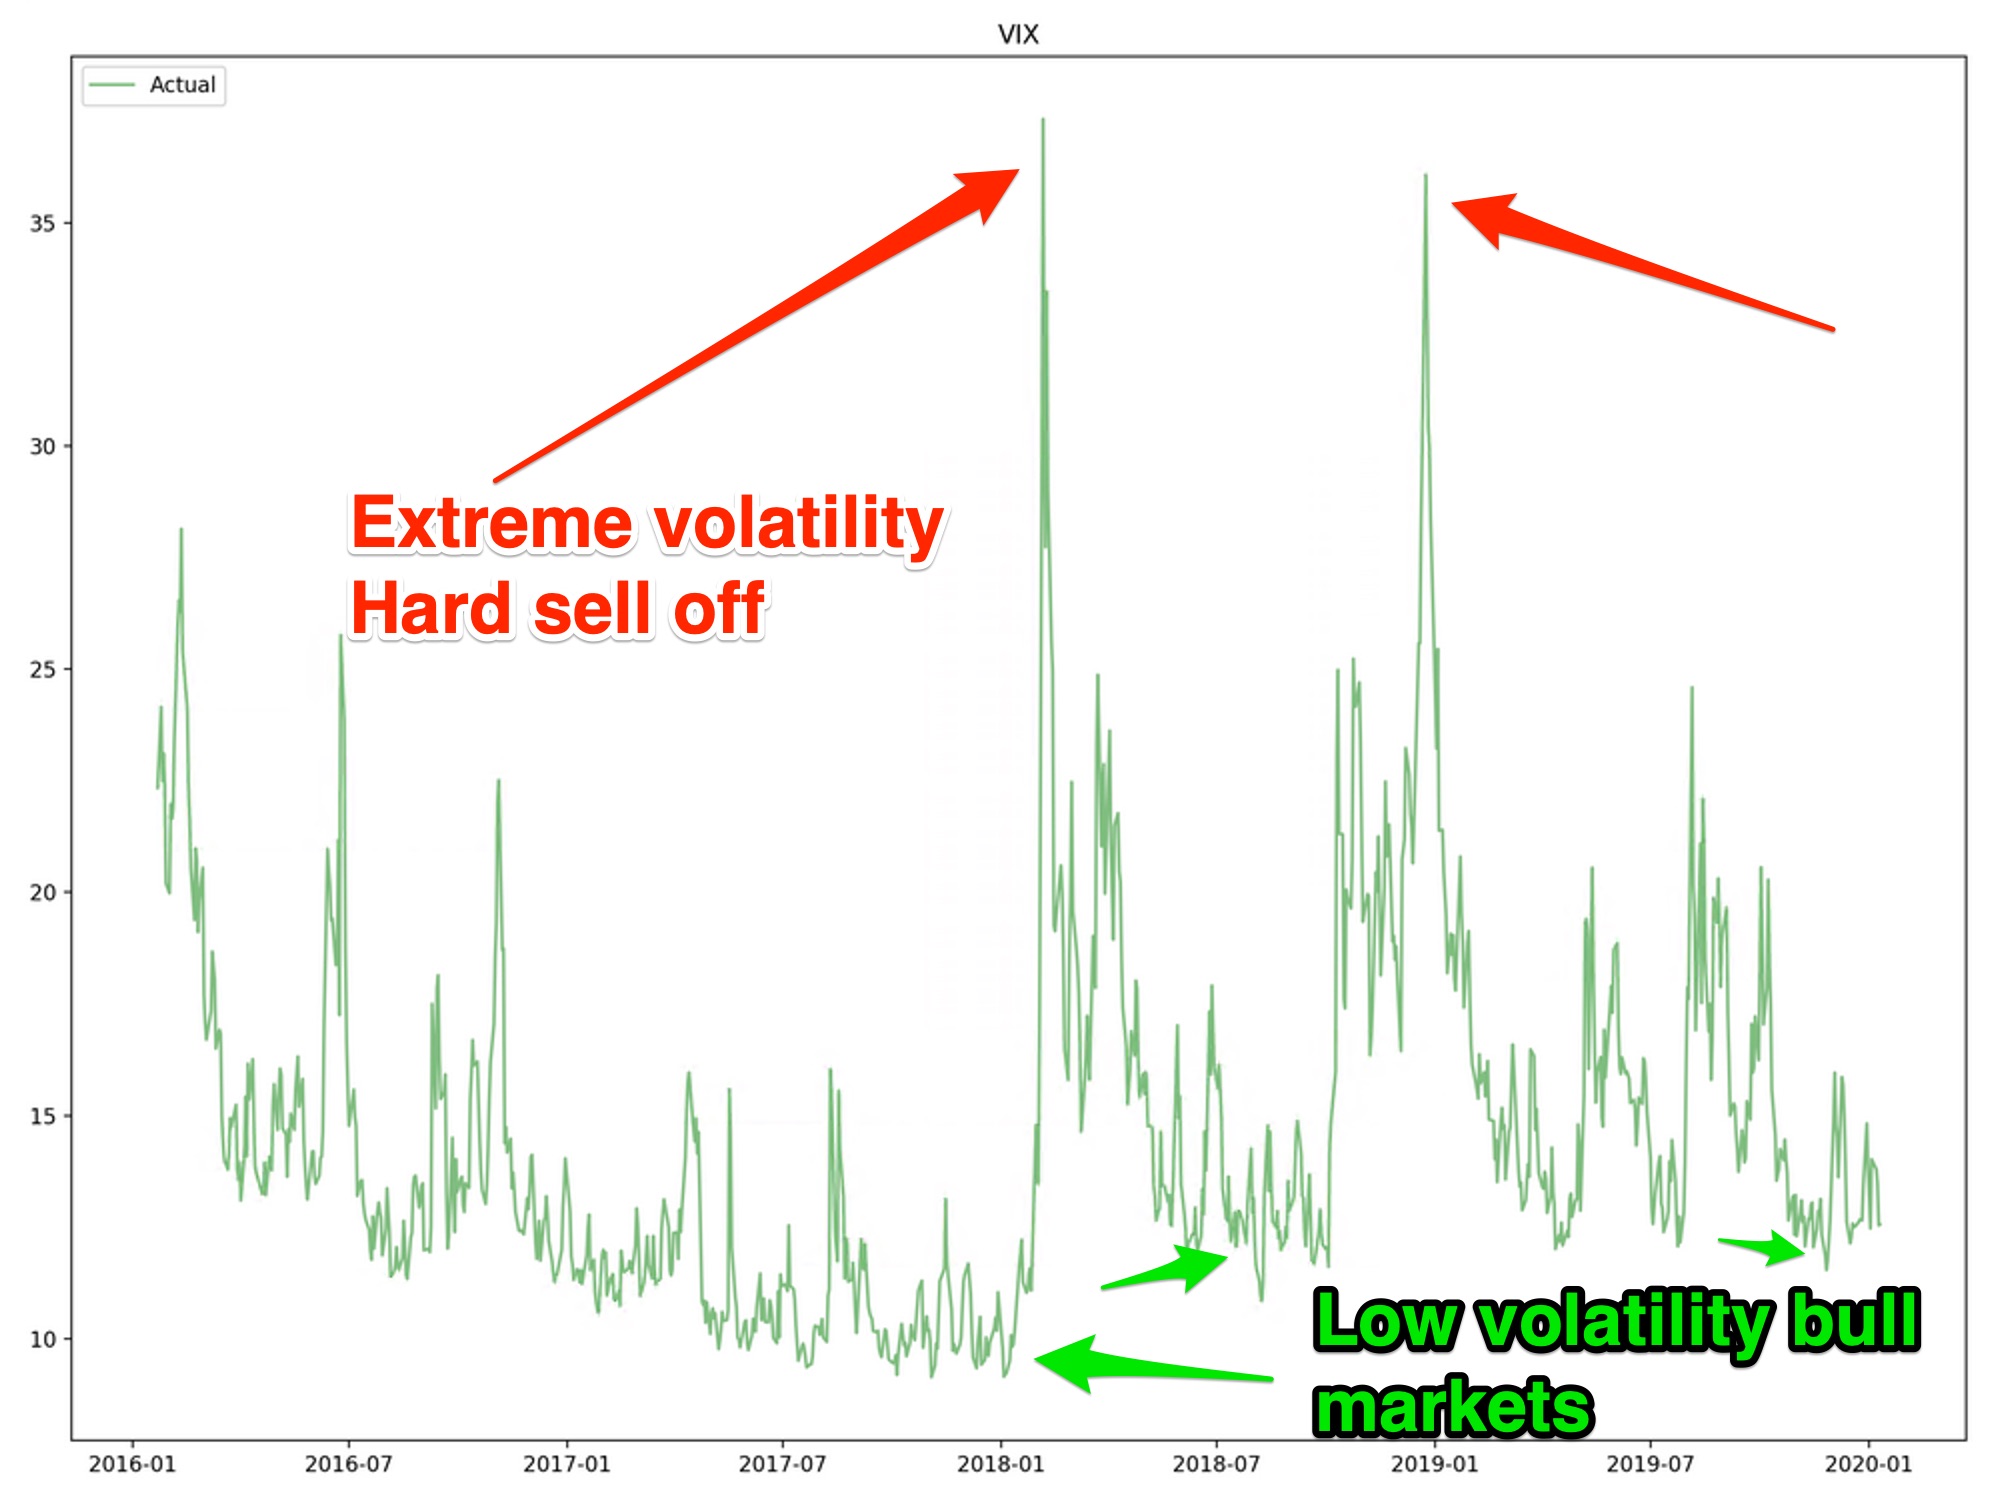
You can see during early 2018, the VIX exploded higher to over 35. On February 5th, 2018 the VIX opened around 16 and hit close to 37 late in the trading session that day. That double destroyed two volatility ETFs that track the inverse of the VIX, XIV and SVXY. Now let's look at VIX and VIX3M together.
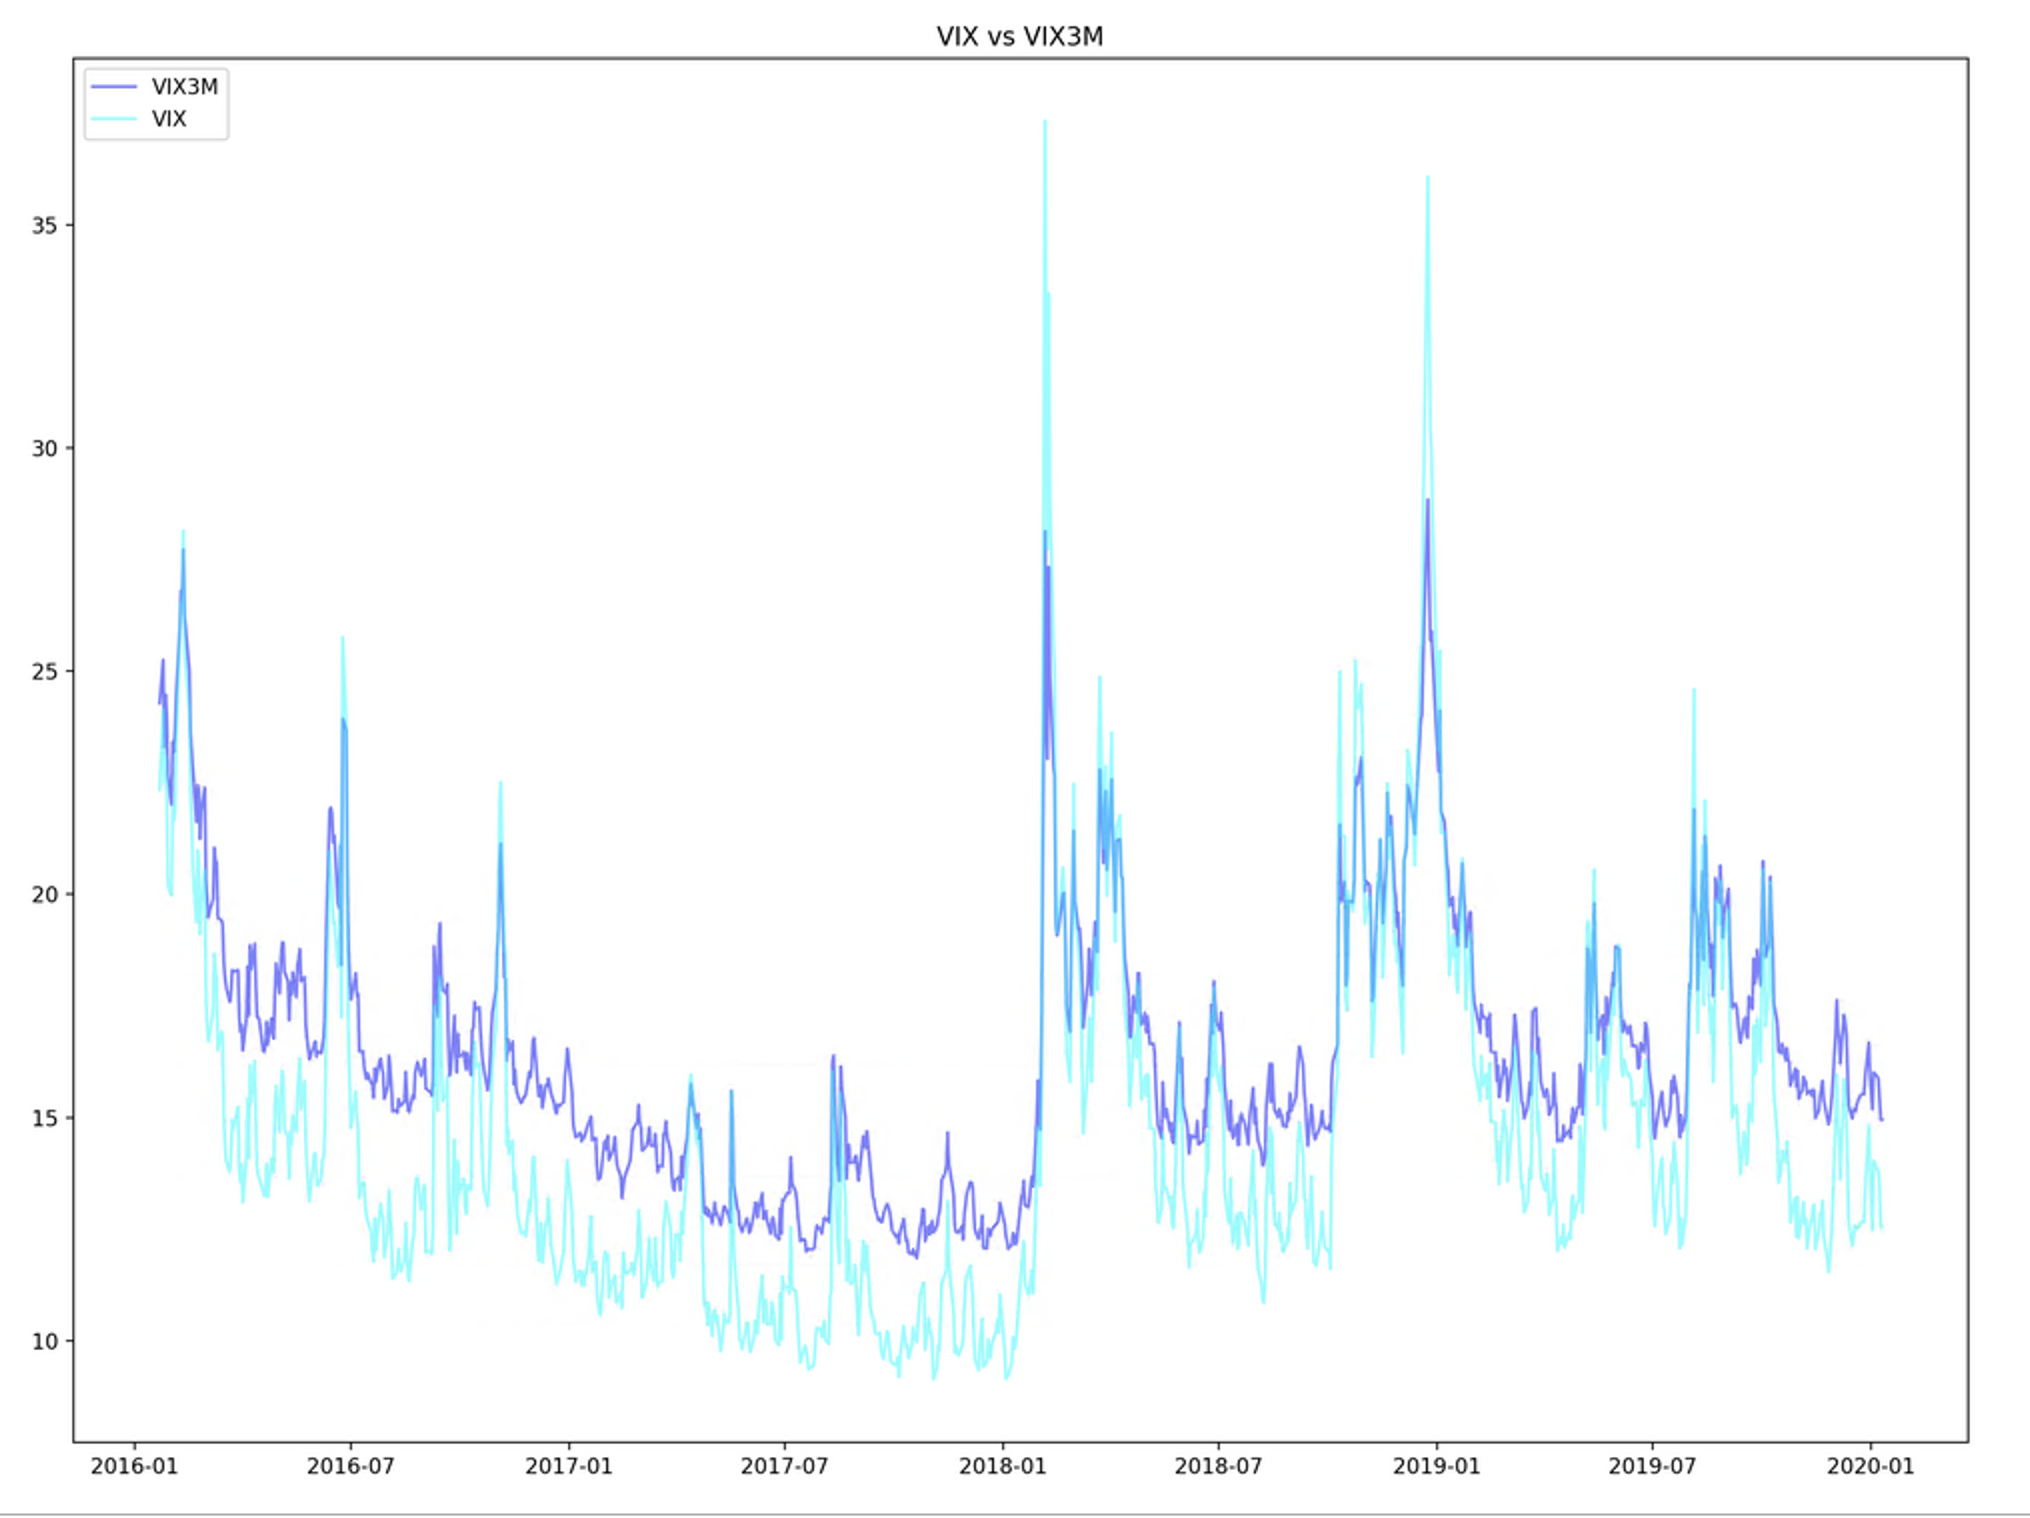
The VIX3M is calculated the same way as the VIX with the only exception being the average time to expiration is 93 days instead of 30 days.
When plotting the VIX and VIX3M together, we can gather more insights about the two. The VIX3M and VIX tend to move together, however the VIX moves to more extremes than the VIX3M. The VIX tells us about whats going on in the options market right now. The VIX3M gives us an idea of what the markets think the options market will look like three months out. The VIX tends to influence the IVTS calculation more than the VIX3M.
Now we can see the IVTS from it's VIX and VIX3M compadres:
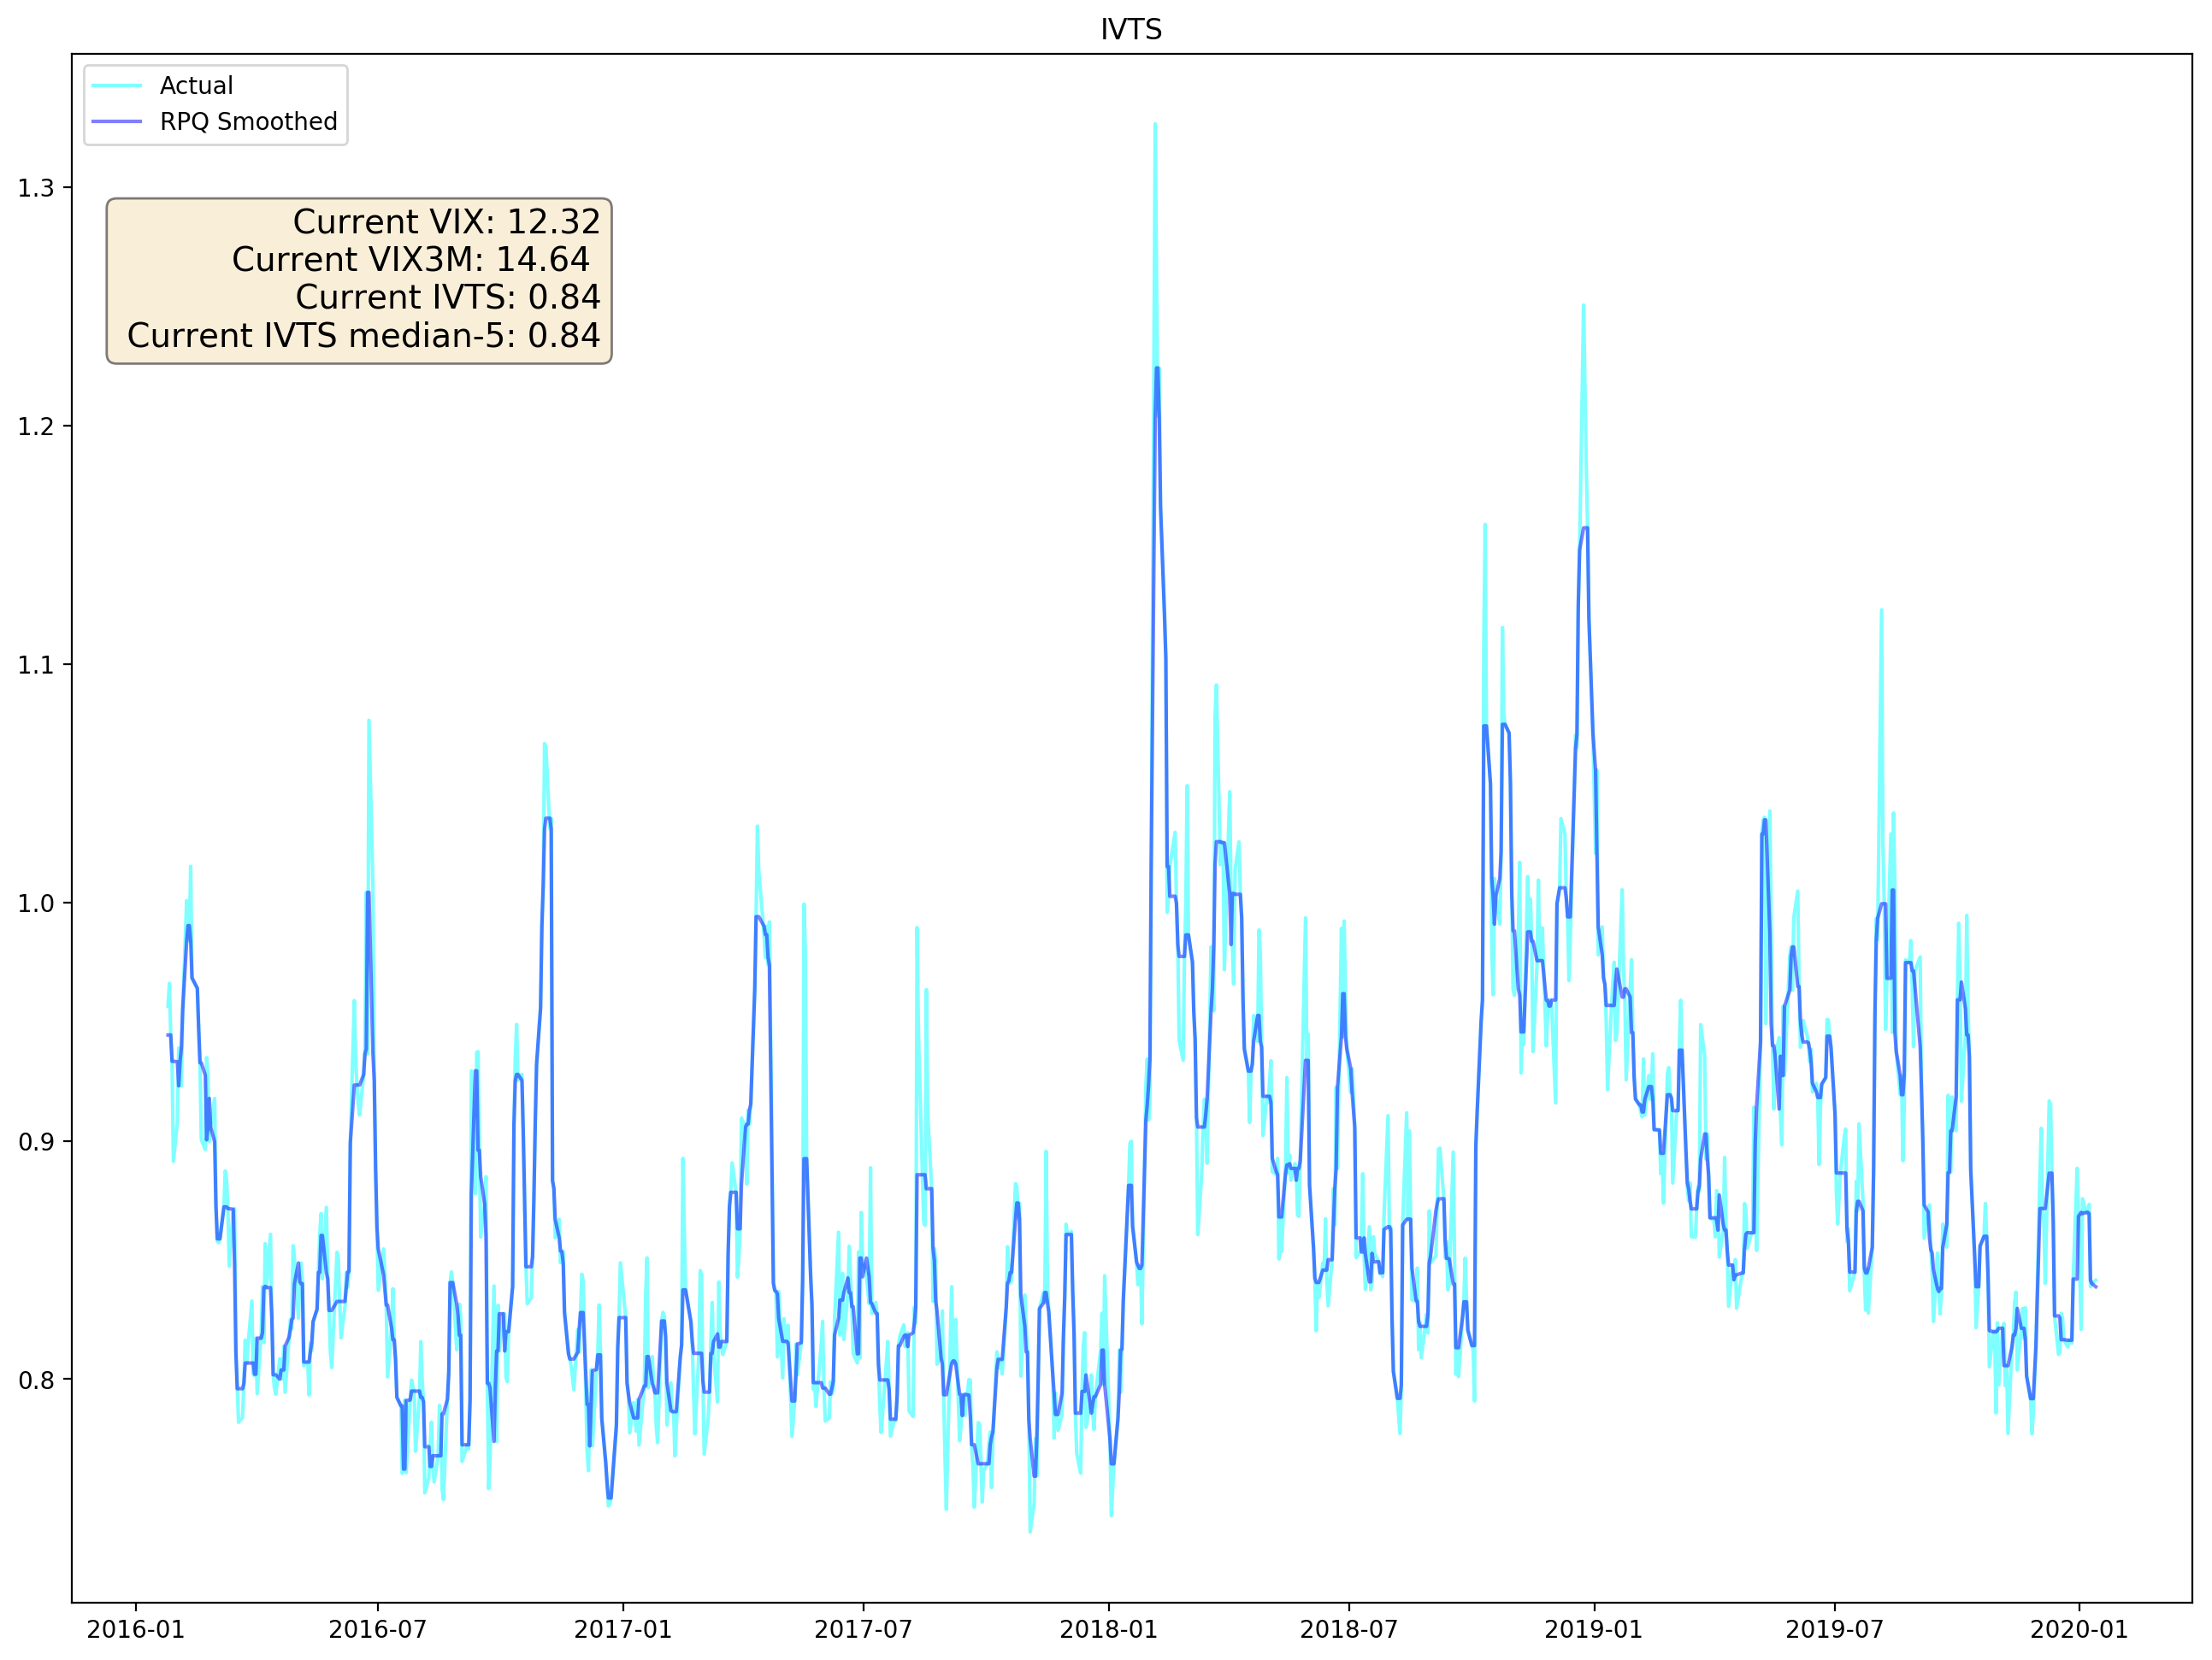
The plot shows both the raw IVTS value and our RPQ smoothed value. In the course section on IVTS trading strategies, we cover the smoothed value in more detail. For now, the important thing to know is the VIX can whip around and we need a simple method of smoothing it to prevent from getting whipsawed out of trades.
And finally, we can see IVTS and SPY together.
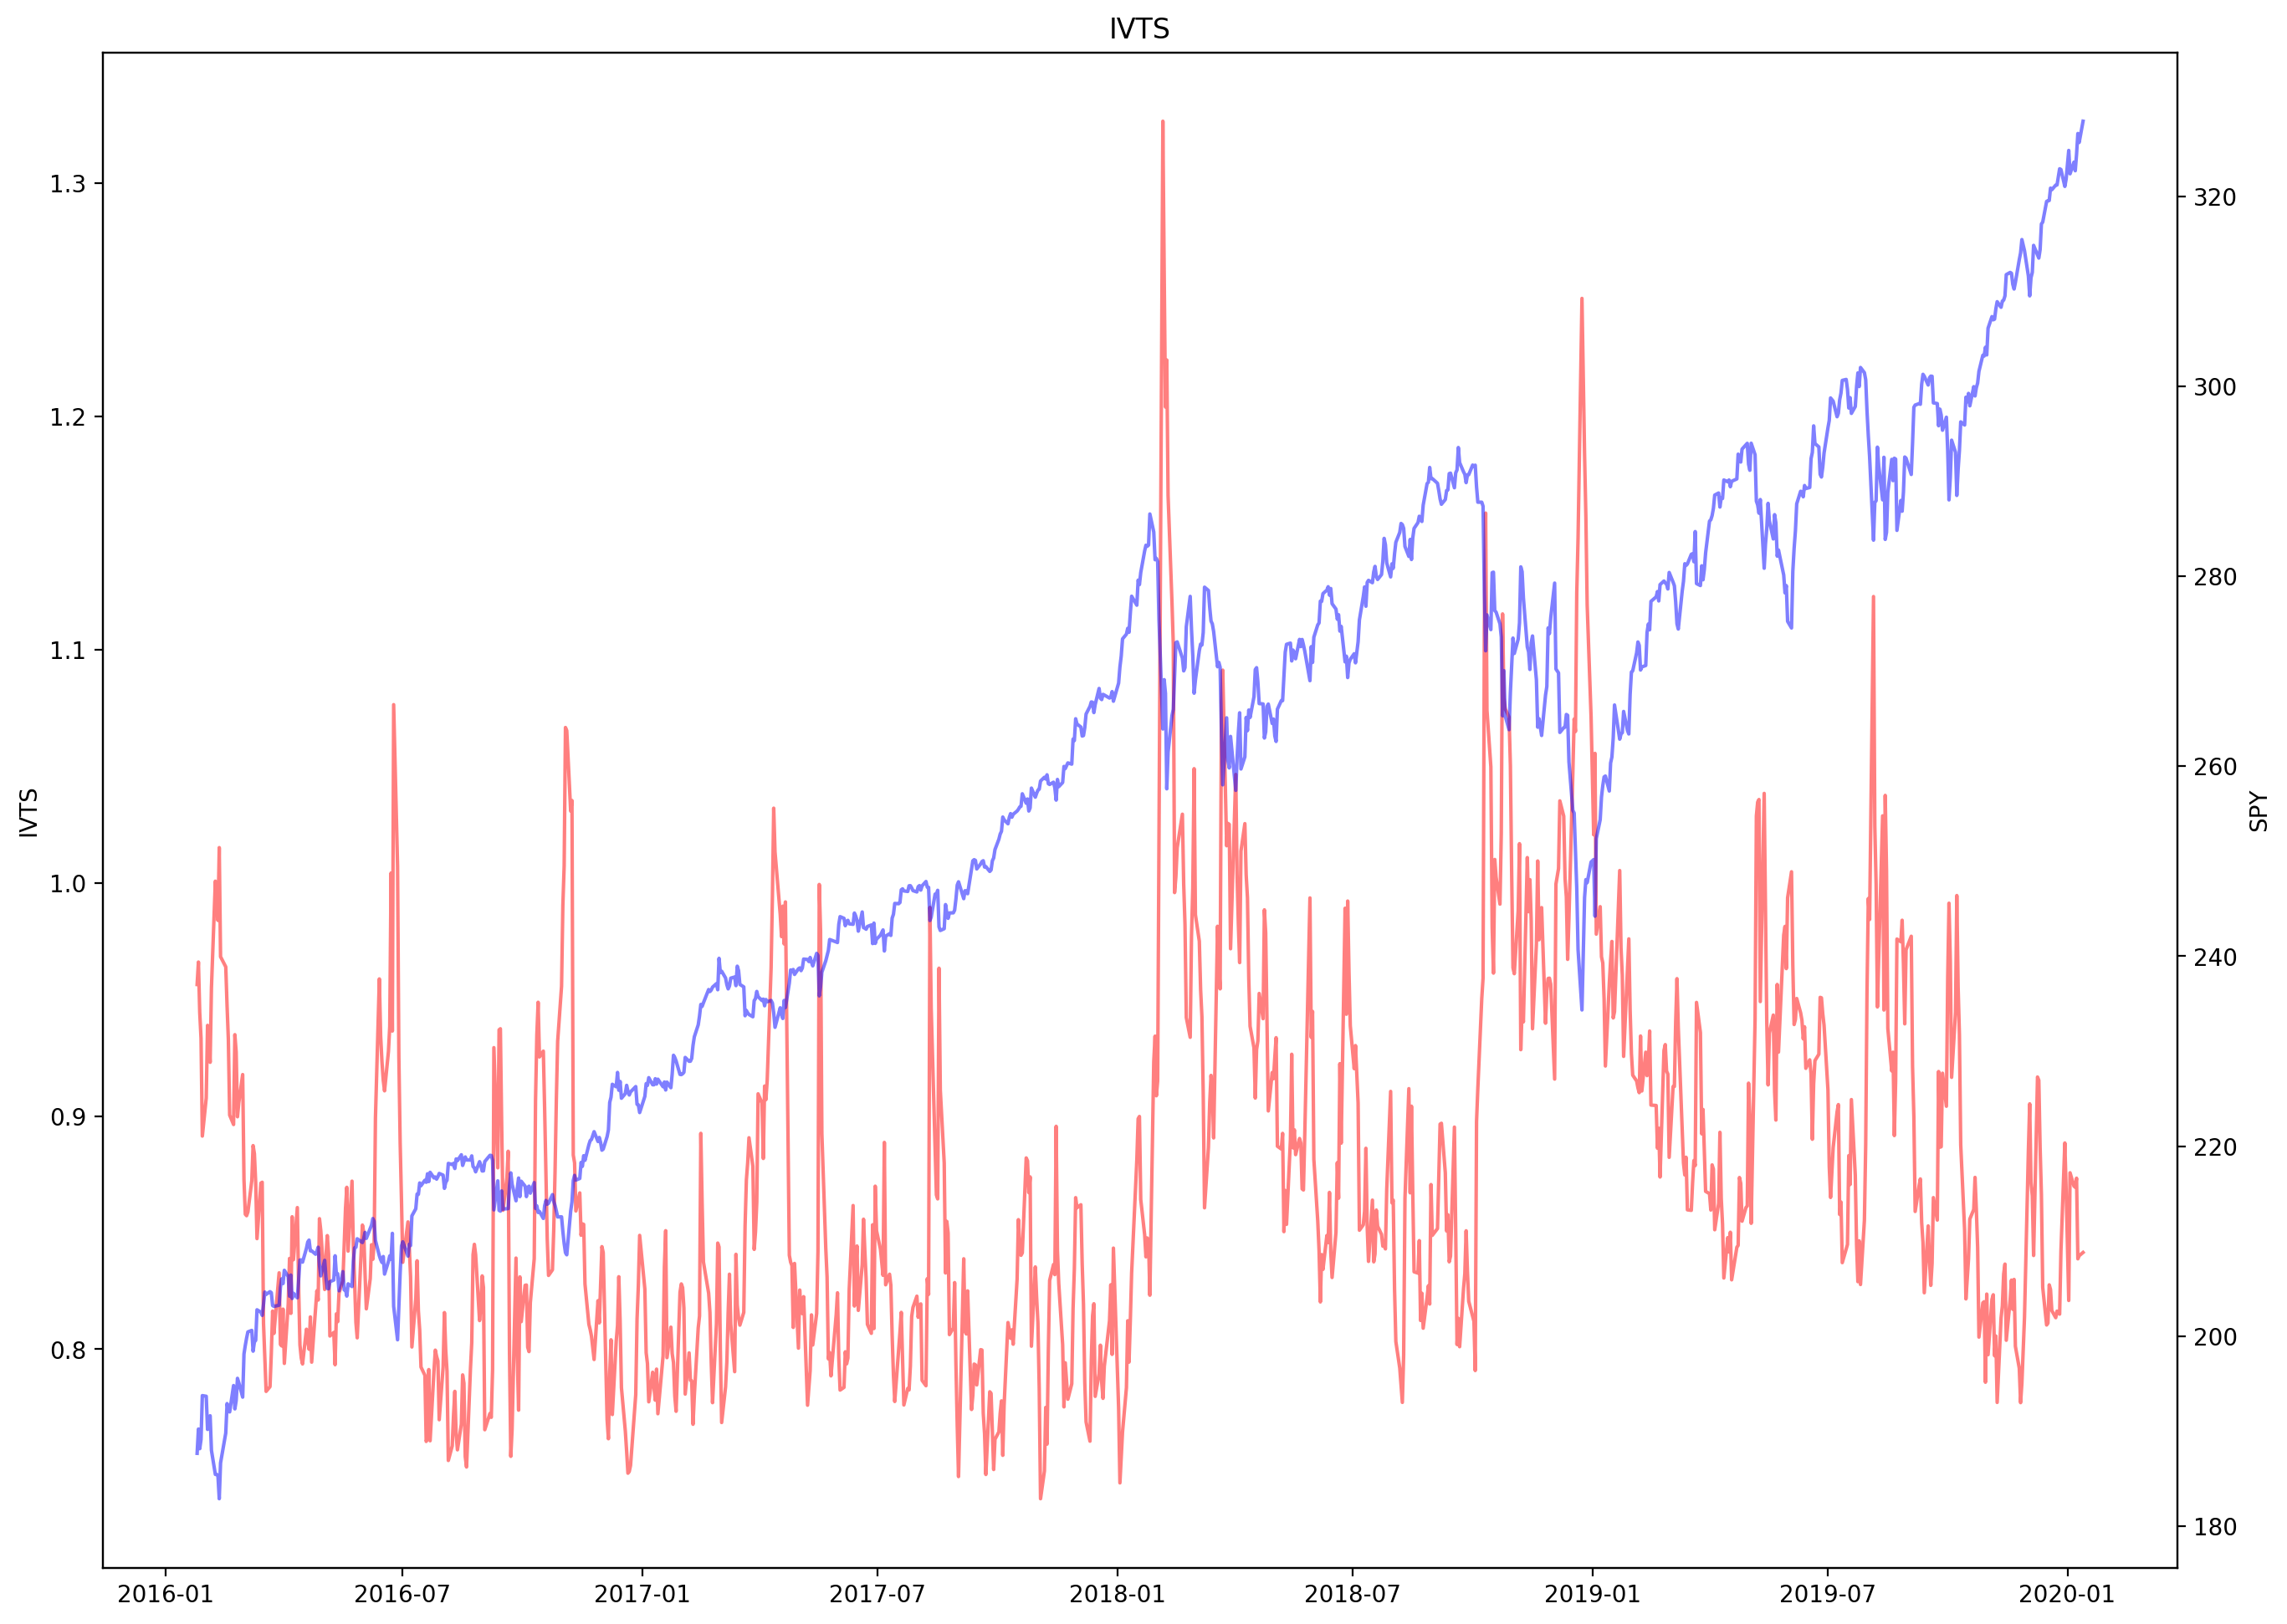
This plot shows us some of they key characteristics of IVTS (red) and it's relationship with SPY (blue).
- Violent IVTS spikes over 1.0 are fast and short lived and accompany violent sell offs in SPY.
- There are only four occurrences where the IVTS spiked over 1.1 from 1/1/16 - 1/13/20.
- Sustained bull markets tend to happen when the IVTS is below .95.
However these only scratch the surface of why IVTS is one of the few metrics you really need to concern yourself with. It is, hands down, the most important metric that influences more of my trading than anything. Bar none.
There are literally 100s of papers written by quant professionals (many PhDs) on the IVTS or some variant of it. There is a reason for it - once you understand how the IVTS works, it is the biggest edge you will likely ever have in trading. Period. I've literally spend 1000s of hours researching it and coding strategies around the IVTS. I would say it is my area of trading expertise.
Quants know it and now you know it too.
When the VIX goes wrong
Since we're talking shop about the VIX, an intro to the volatility ETF destruction of February 2018 deserves some screen time. Why both of the XIV and SVXY ETFs were destroyed requires a quick refresher in how dangerous short selling can be of extremely volatile instruments.
If we are bears on AMD and we had a $25,000 trading account, we could short the stock at $40 with our entire account. If the stock price drops to $20, we would make 50% or 50% x $25,000 = $12,500. However let's look at what happens if the trade goes the other way - the stock shoots up.
If the stock shoots up to $60, we would lose -50% ($40 - $60) / $40 = -50%. -50% x $25,000 = -$12,500.
But what happens if AMD stock goes up to $100? That math looks like this: ($40 - $100)/$40 = -150%. -150% x $25,000 = -$37,500.
Now you can see the big problem this poses. If you only had a $25k trading account, you're now -$12,500 in the hole ($25,000 - $37,500 = -$12,500). With short selling, it's entirely possible to lose more than you are risking in your account.
So what happens in this scenario when a trading account goes negative? What happens is you will get a call from the funding department at your broker and they will demand you wire in the amount to bring your account balance back to zero. In this case, you would need to wire in $12,500 just to bring your account back to zero.
This isn't theoretical worry warts screaming from the mountain tops. As a seasoned veteran, I've seen it happen to many a trader, including me in my early days. And it really sucks when it happens.
This actually happened to lots of people on February 5th, 2018. XIV closed around $80 on 2/5/18 and opened around $10 on 2/6/18. Likewise, UVXY and TVIX which were both 2x leveraged volatility ETFs, more than doubled. This laid waste to many trading accounts and the VIX levels have been elevated since.
What happened is, those in the know, started selling XIV hard in the post market 2/5/18. I was watching the price live as it was water falling down by $1 every 5 seconds from $80 down to $10. What traders in the know realized is that XIV was now in the negative - it was bankrupt and the ETF would be wiped out when it opened on 2/6/18.
Lots of people got phone calls from their brokers on 2/6/18 demanding they wire cash into their accounts to bring them back to zero.
I was holding XIV on the close 2/5/18. One of the benefits of prop trading is you have a team watching out for you that has your back. I was very fortunate to get the intel on what was happening quickly and got out of XIV around $68. I was an exception and very lucky, but I still took a big kick in the cojonies on XIV.
For this reason, Mike and I never, ever ever ever recommend anyone hold any volatility ETF short overnight. Being short VXX, UVXY, TVIX or VIXY is acceptable for day trading, but holding these short overnight is a death sentence to your trading account. It will happen.
But how do we trade volatility?
The VIX is just an index published by the CBOE that measures implied volatility. We can't trade the VIX, just like we can't trade the Dow Jones Industrial Average directly, it's just an index. However where there is a substantial profit to be made through fees or trading activity, rest assured it won't be long before someone figures out how to trade it.
Such is the case with volatility. The first major trading vehicle that trades based on the VIX are the VX futures and were introduced on March 26, 2004. The VX futures are tightly correlated to the moves of the VIX. They don't do a perfect job of tracking the VIX, but they do a decent enough job. The intraday correlation between the VIX and VX futures is around .75.
The VX futures contract moves in increments of .05 (or one tick is .05 in futures speak) and is leveraged at $1000 for every 1.0 move in the VIX. The margin requirements for VX futures vary, but generally are around $6k per contract for the front month. If you have no idea what front month contract means, don't worry, I'll break it down into English shortly.
So if we bought one VX contract (wen are long one contract) and the VX shot up from 13.0 to 15.0, we would make $2000.
Likewise, if were short one VX contract and the VX moved from 15.0 down to 13.0 we would profit $2000. In this same example, if we were short one contract at 15.0 and the VX futures moved to 17.0, we would take a loss of -$2000.
OK.. so where does the TS in IVTS comes from?
Trading futures is not for everybody, including me. I prefer to trade stocks and options. But in the world of volatility trading, the VX futures most closely follow the VIX.
Futures trade much different than stocks and there is bit more geekery involved to understand how they are different than stocks.
The first major difference between stocks and futures contracts is futures contracts expire on a certain date. Stocks never expire. When you buy a stock, you can hold it forever.
Futures don't work that way and typically expire every month. The lingo expiration date is used interchangeably as the settlement date. This lingo comes from the history of how the futures markets were developed, which was primarily for trading commodities such as coal, oil, corn, gold etc. during the mid 1800s in Chicago. This is where the Chicago Mercantile Exchange was born from.
Using crude oil to understand the VIX
Understanding how VIX futures work (symbol /VX) and why the price of /VX futures is different than the VIX is a bit hard to wrap your head around. That is, if we take the direct path of just trying to understand the difference between /VX futures and the VIX.
From teaching this to many traders, I found that most will easily grasp the mechanics of /VX futures by understanding how crude oil futures work. Mainly because crude oil is something tangible, we can fill up a tanker truck with crude oil. We can't fill up a tanker truck with /VX futures.
The Widget Factory and crude oil futures
A history lesson from the mid 1800s makes modern day futures markets much easier to understand. Let's imagine have a widget factory and we need to buy crude oil every month to power the steam engines in our widget factory. We have a big 'ole 20,000 barrel oil tank that we burn through every month.
At the end of the month, we need to have tanker trucks come out and fill up our tank with 20,000 barrels of oil. On the last day of every month, a bunch of tankers come out, fill the tank and we pay them for the oil.
In our widget factory, we can turn a profit if crude is under $70 a barrel. Any time crude goes over $70, we can no longer make a profit because the cost of oil eats all of our profits away. So the cheaper we can buy oil, the more profitable our widget factory is.
On March 2nd, Mexico announces that they've found 400 trillion gazillion barrels of oil, essentially increasing the world supply of oil by 50%. As a result, the price of oil nose dives from $60 to $35 as an over reaction to the news. We feel it's a temporary over reaction to the news and want to take advantage of that by purchasing the 20,000 barrels of oil for $35 right now!
Ohh where or where do we put an extra 20,000 barrels of oil?
There is a problem though - our 20,000 barrel oil tank was just filled a few days ago and we don't have room to store an extra 20,000 barrels of oil. And a second problem is our widget factory is a little tight on cash right now and doesn't have the cash to buy an extra 20,000 barrels of either. Since we just paid for 20,000 barrels of oil a few days ago and being March 2nd, it's the beginning of the month.
Futures contracts solve both of these problems for the widget factory. First let's look at the storage problem.
Most futures contracts expire every month, as is the case with crude oil futures. Many futures contracts for commodities are hard settled, which means when the contract expires, we take physical delivery of whatever the contract is for. If we buy one crude oil future (the futures symbol for crude oil is /CL), we would literally be taking delivery of 1,000 barrels of oil when the contract expires. One /CL contract is for 1,000 barrels of oil.
If we buy the March /CL contract, for our purposes, we would be taking delivery of our 20,000 barrels of oil on the last day of the month. Just when we need it, when the 20,000 barrel oil tank at our widget factory is near empty.
Today is March 2nd, we can buy 20 /CL contracts which will deliver 20,000 barrels of oil to us on the 31st of the month. This is perfect, since it solves the first problem for us, which is where do we store 20,000 barrels of oil? Now we don't have to store it since we don't have to take delivery of the oil until the 31st of the month, just when our 20,000 barrel tank is empty and we need it.
But what about the second problem, paying for 20,000 barrels of oil on the 2nd of March when we won't have the cash to buy it until the end of the month? Futures also solves this problem for us by using what is referred to as margin. Think of margin as a deposit that we're committing to buy a barrel of oil. It's just like putting down earnest money when we buy a house.
When we by 20 /CL contracts, we don't have to pay for 20 /CL contracts, rather we just pay the margin amount. Currently, it's around $4,000 per /CL contract. Let's do some math here to see how much buying power this gives us.
We're buying 20 /CL contracts for oil at $35/barrel. Each /CL contract is for 1,000 barrels of oil.
20 contracts x 1000 barrels/contract x $35/barrel = $700,000
In the end, we're paying $700k for the oil we need. But we don't have to pay for the oil until we take delivery of it on the 31st of the month. When we buy the 20 /CL contracts on March 2nd, we just have to put up the margin amount. So on March 2nd when we buy 20 /CL contracts at $35:
20 contracts x $4000 margin/contract = $80,000
Rather than having to put up the full $700k, we only have to put up $80k. We don't have to pay the balance of $620k ($700k - $80k = $620k) until March 31st until we take delivery of the oil.
Both problems solved
Futures solve both the 1) storage problem and 2) cash requirement for oil and our widget factory. This is where the trading of futures is advantageous and how they were initially used. Not as trading vehicles, but for commodity producers like oil companies and commodity consumers like our widget factory - to buy and sell commodities.
The first piece to look at is the margin. For the /CL futures, we can see we get a lot of leverage. In this case, $80k of cash allowed us to control $700k worth of oil.
$700k/$80k = 8.75x leverage
Futures give us tremendous leverage in trading, but there is no free lunch. With our /CL futures contracts, we purchased them on the 2nd of March and took delivery on the 31st of March. That's 28 days between purchasing the contract and taking delivery of the oil. We're 1) paying someone else to store our 20,000 barrels of oil for 28 days and 2) we're essentially borrowing $620k for 28 days. Neither is free and we're going to need to pay for those conveniences.
Just like stock brokers charge interest on using margin, we pay interest on using margin with futures.
Spot price versus futures price
With futures, the futures price is the price for taking delivery when the contract expires. But what about if we wanted to buy oil right now and take delivery right now on the spot? The right now price is called the spot price.
For the reason of needing to pay for storage and interest, the spot price and the futures price are almost always different. The spot price is the price for oil if we want to buy it and take delivery of it right now. The futures prices represents the spot price plus the cost of storage and interest, in our case 28 days. The longer we push out delivery, the more we're going to pay in storage and interest.
In our oil example, if the /CL futures price is $35, the spot price is almost always lower, let's say $33.50. The difference between the two $35 - $33.50 = $1.50 is the amount we're paying for storage and interest. As we get closer to expiration of the /CL contract, the price of /CL and the spot price become very close. In geek speak, we say they converge. This is because since there are fewer days to go until expiration, the less we have to pay for storage and interest.
Circling back to our /VX futures, let's look at the /VX contract that expires on 1/22/2020 (i.e. the lingo is the January 2020 contract) going back to May of 2019.
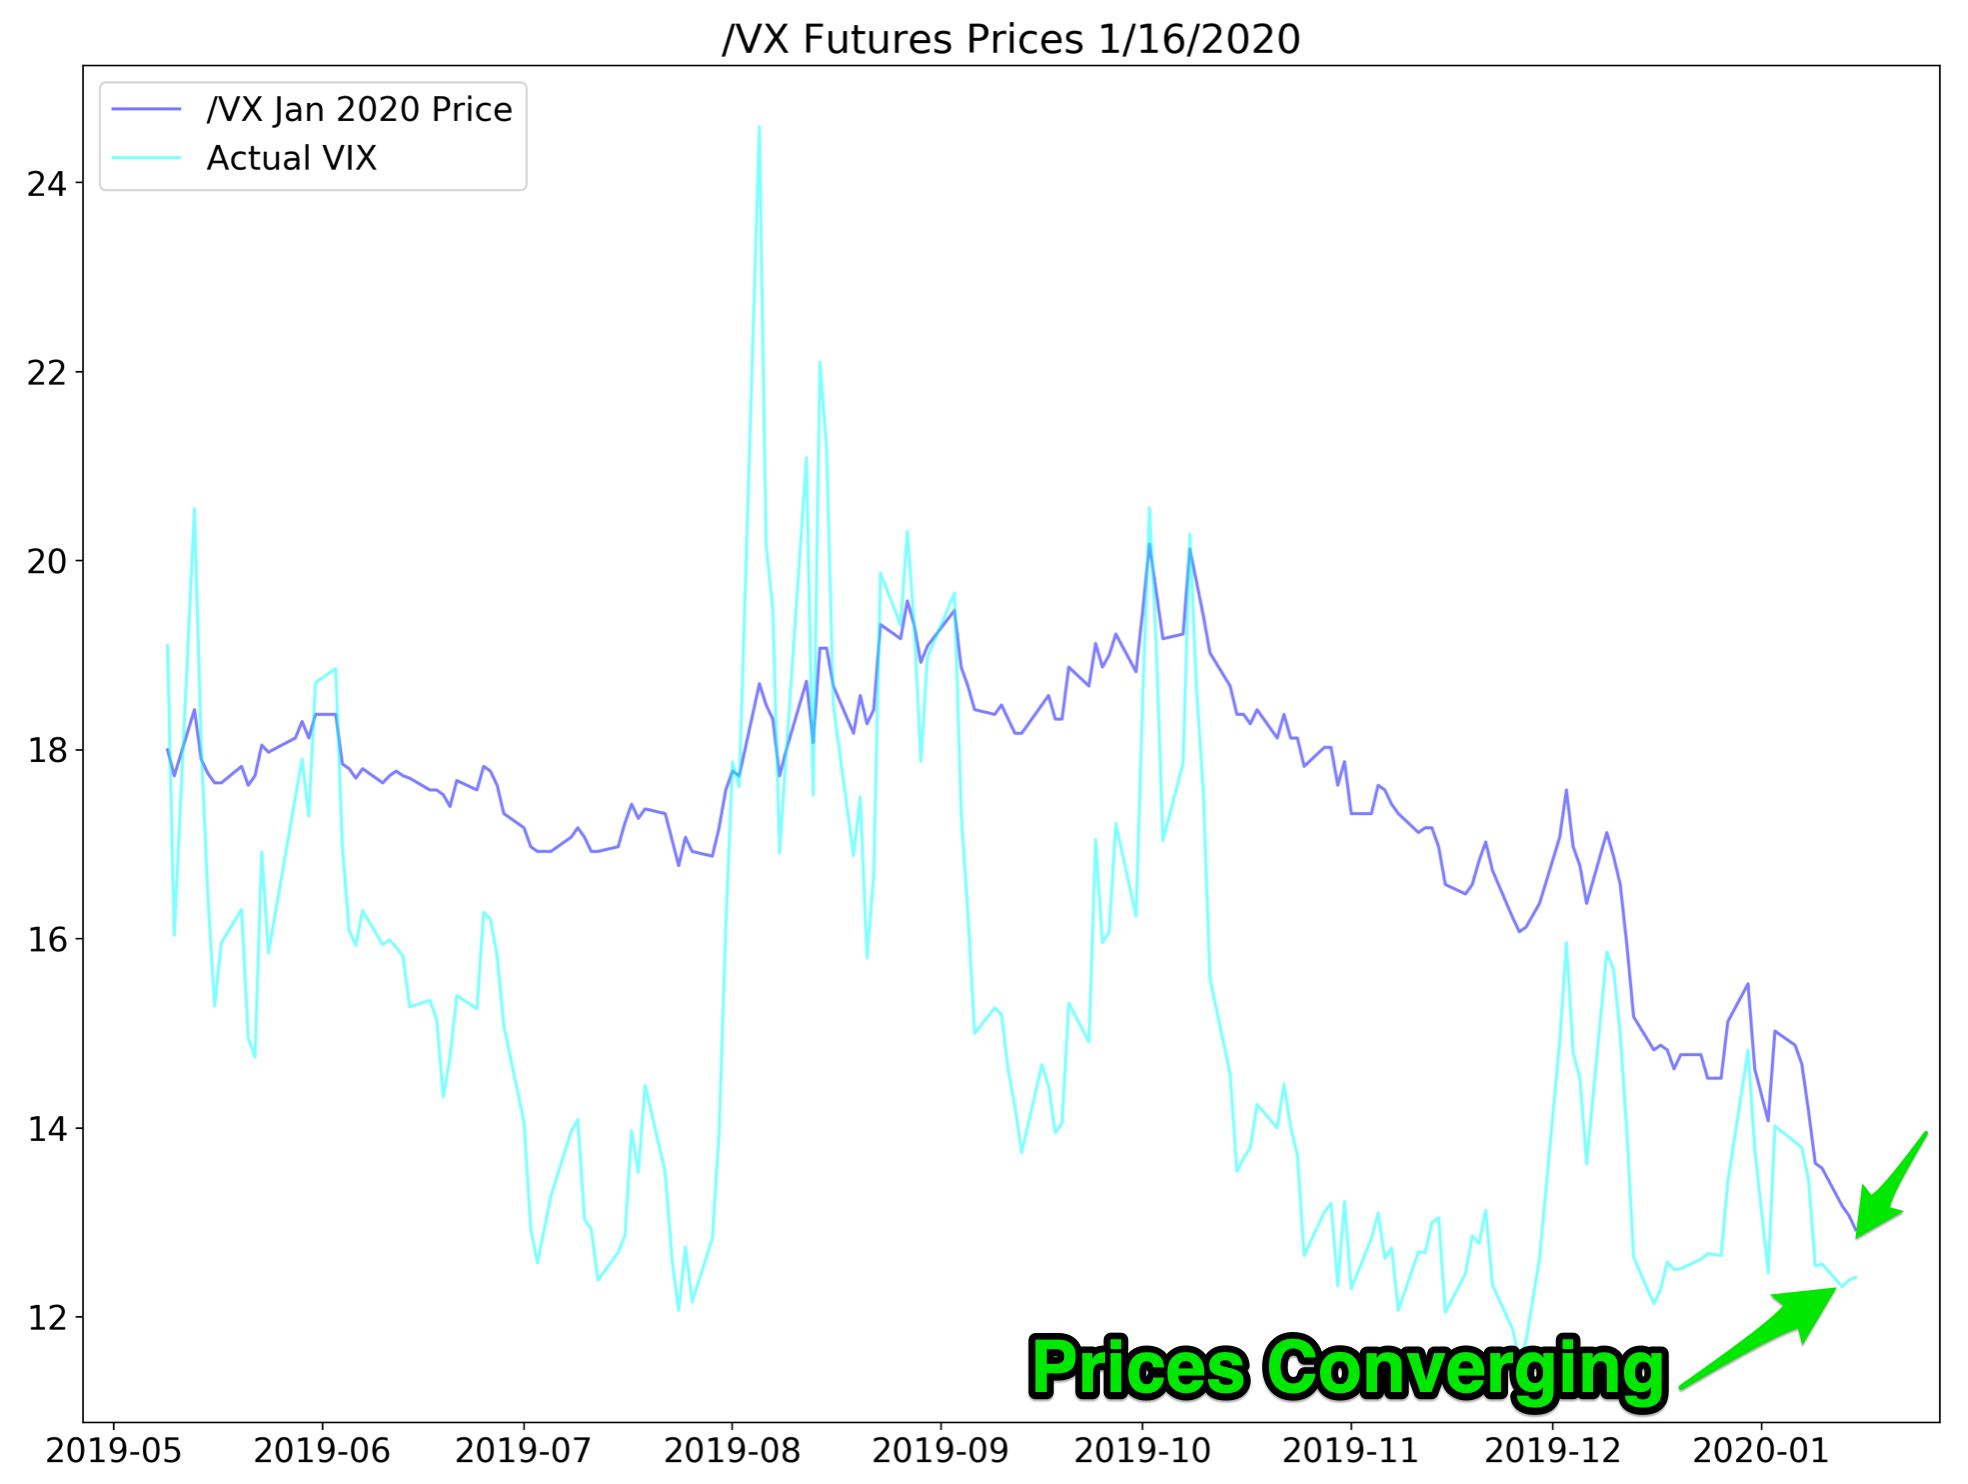
We can see the /VX January 2020 futures, up until about 2019-12, didn't track closely to the actual VIX value. The /VX futures value stayed around 18 +/- 2 until September 2019, while the VIX (light blue) was all over the place. From a low near 12 to a high near 24. But beginning in the past few weeks (mid December 2019), the prices of the /VX January 2020 contract and the VIX started tracking much closer.
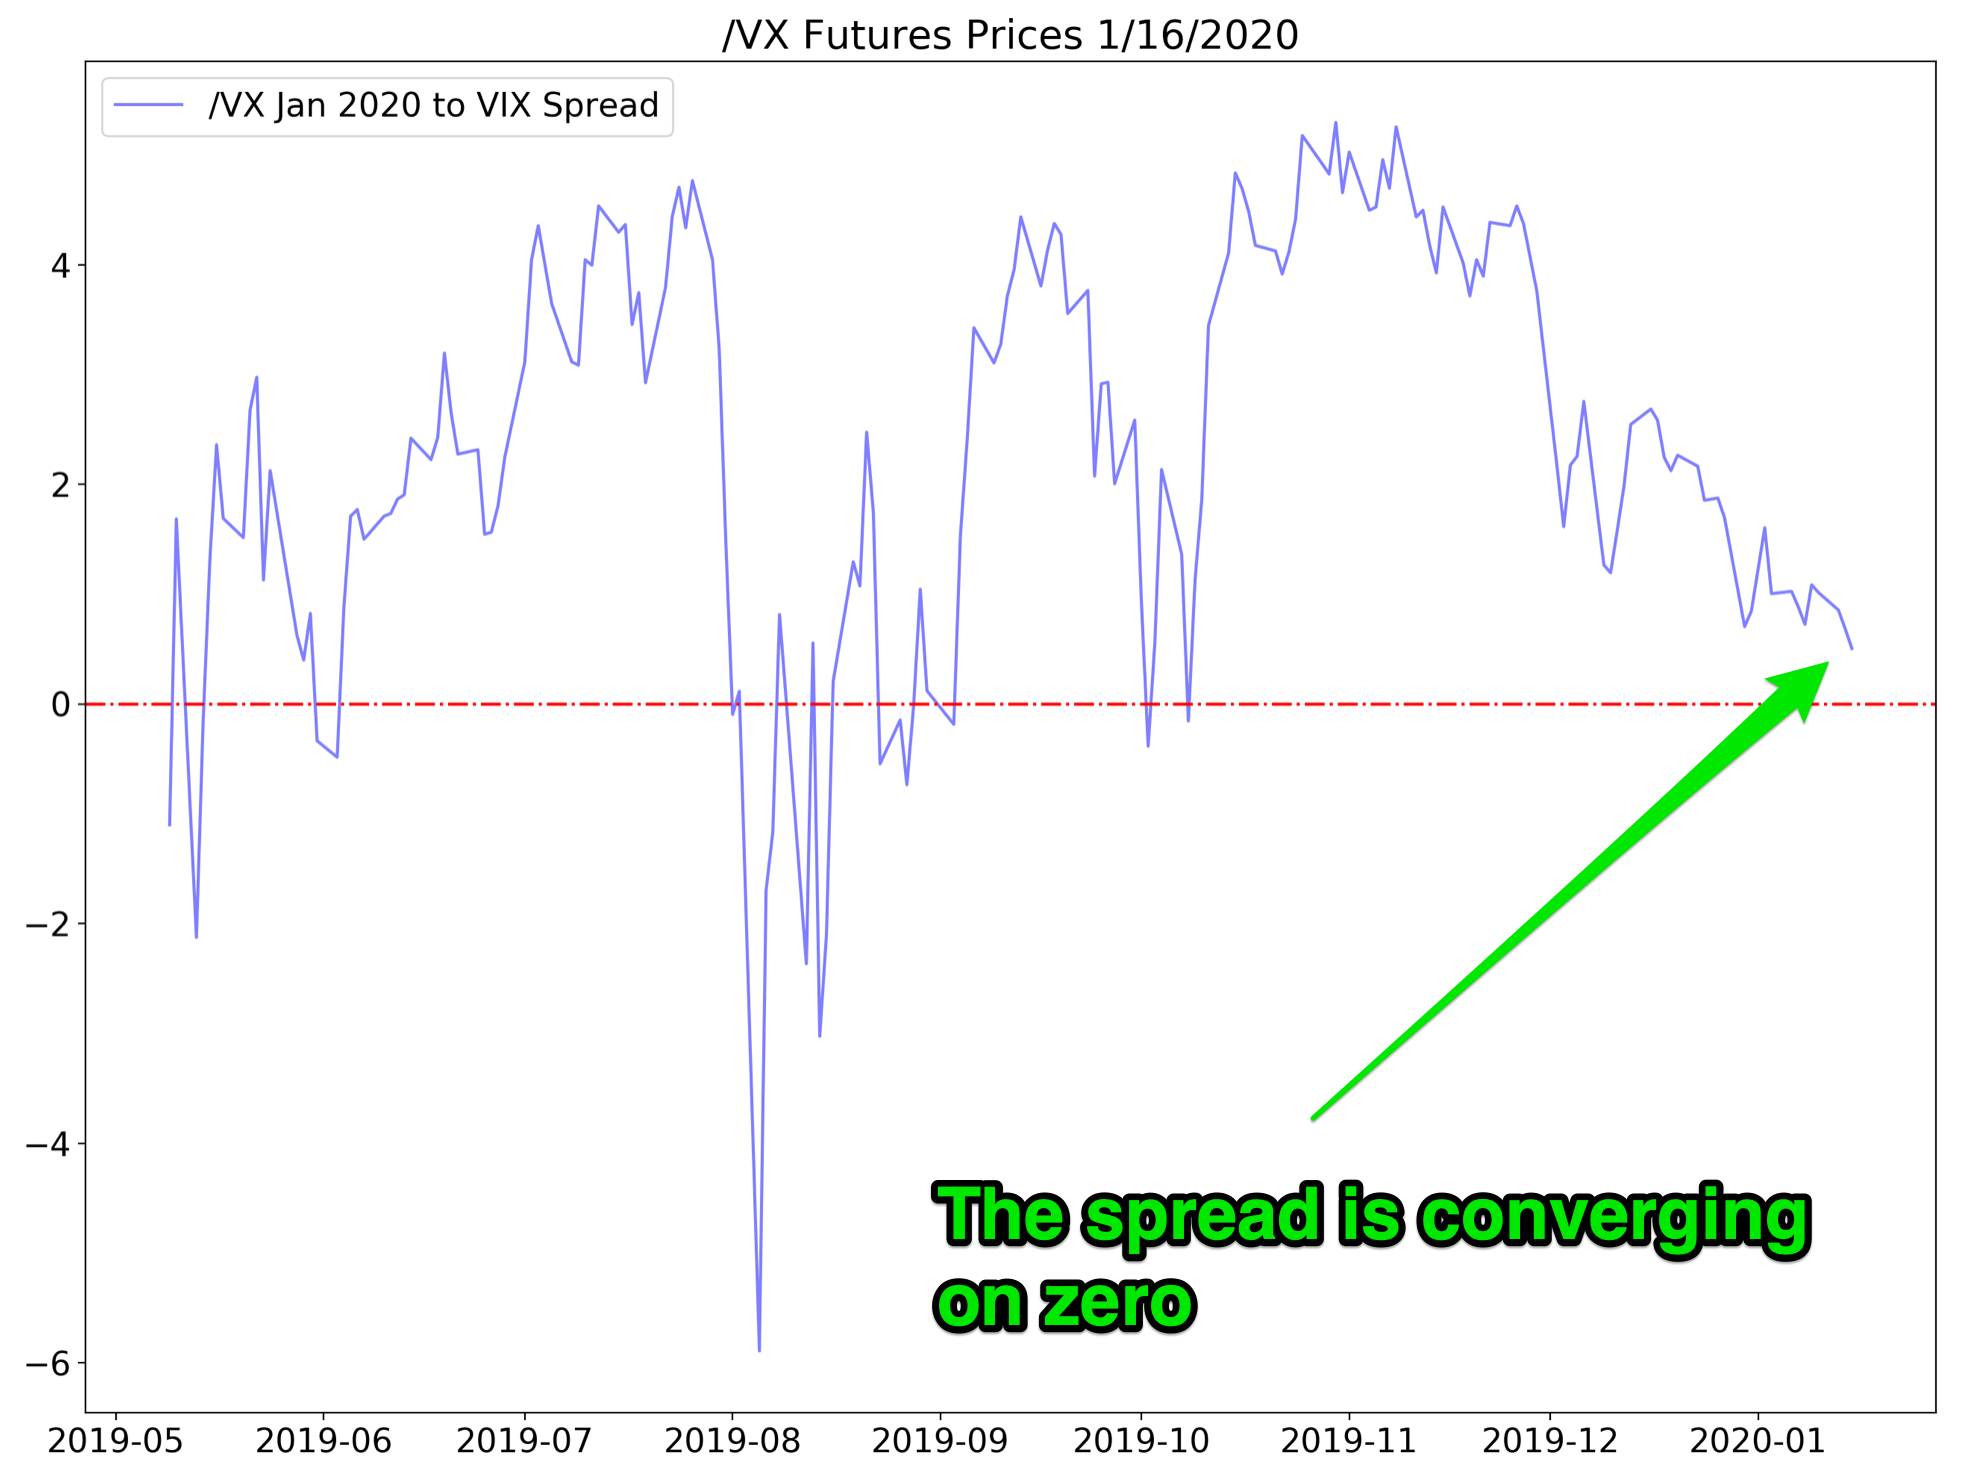
To get a better clue to what this looks like, let's look at just the spread between the /VX futures and the VIX.
Let's zoom in and look at the spread over just the past 60 days, from the beginning of November 2019 through today.
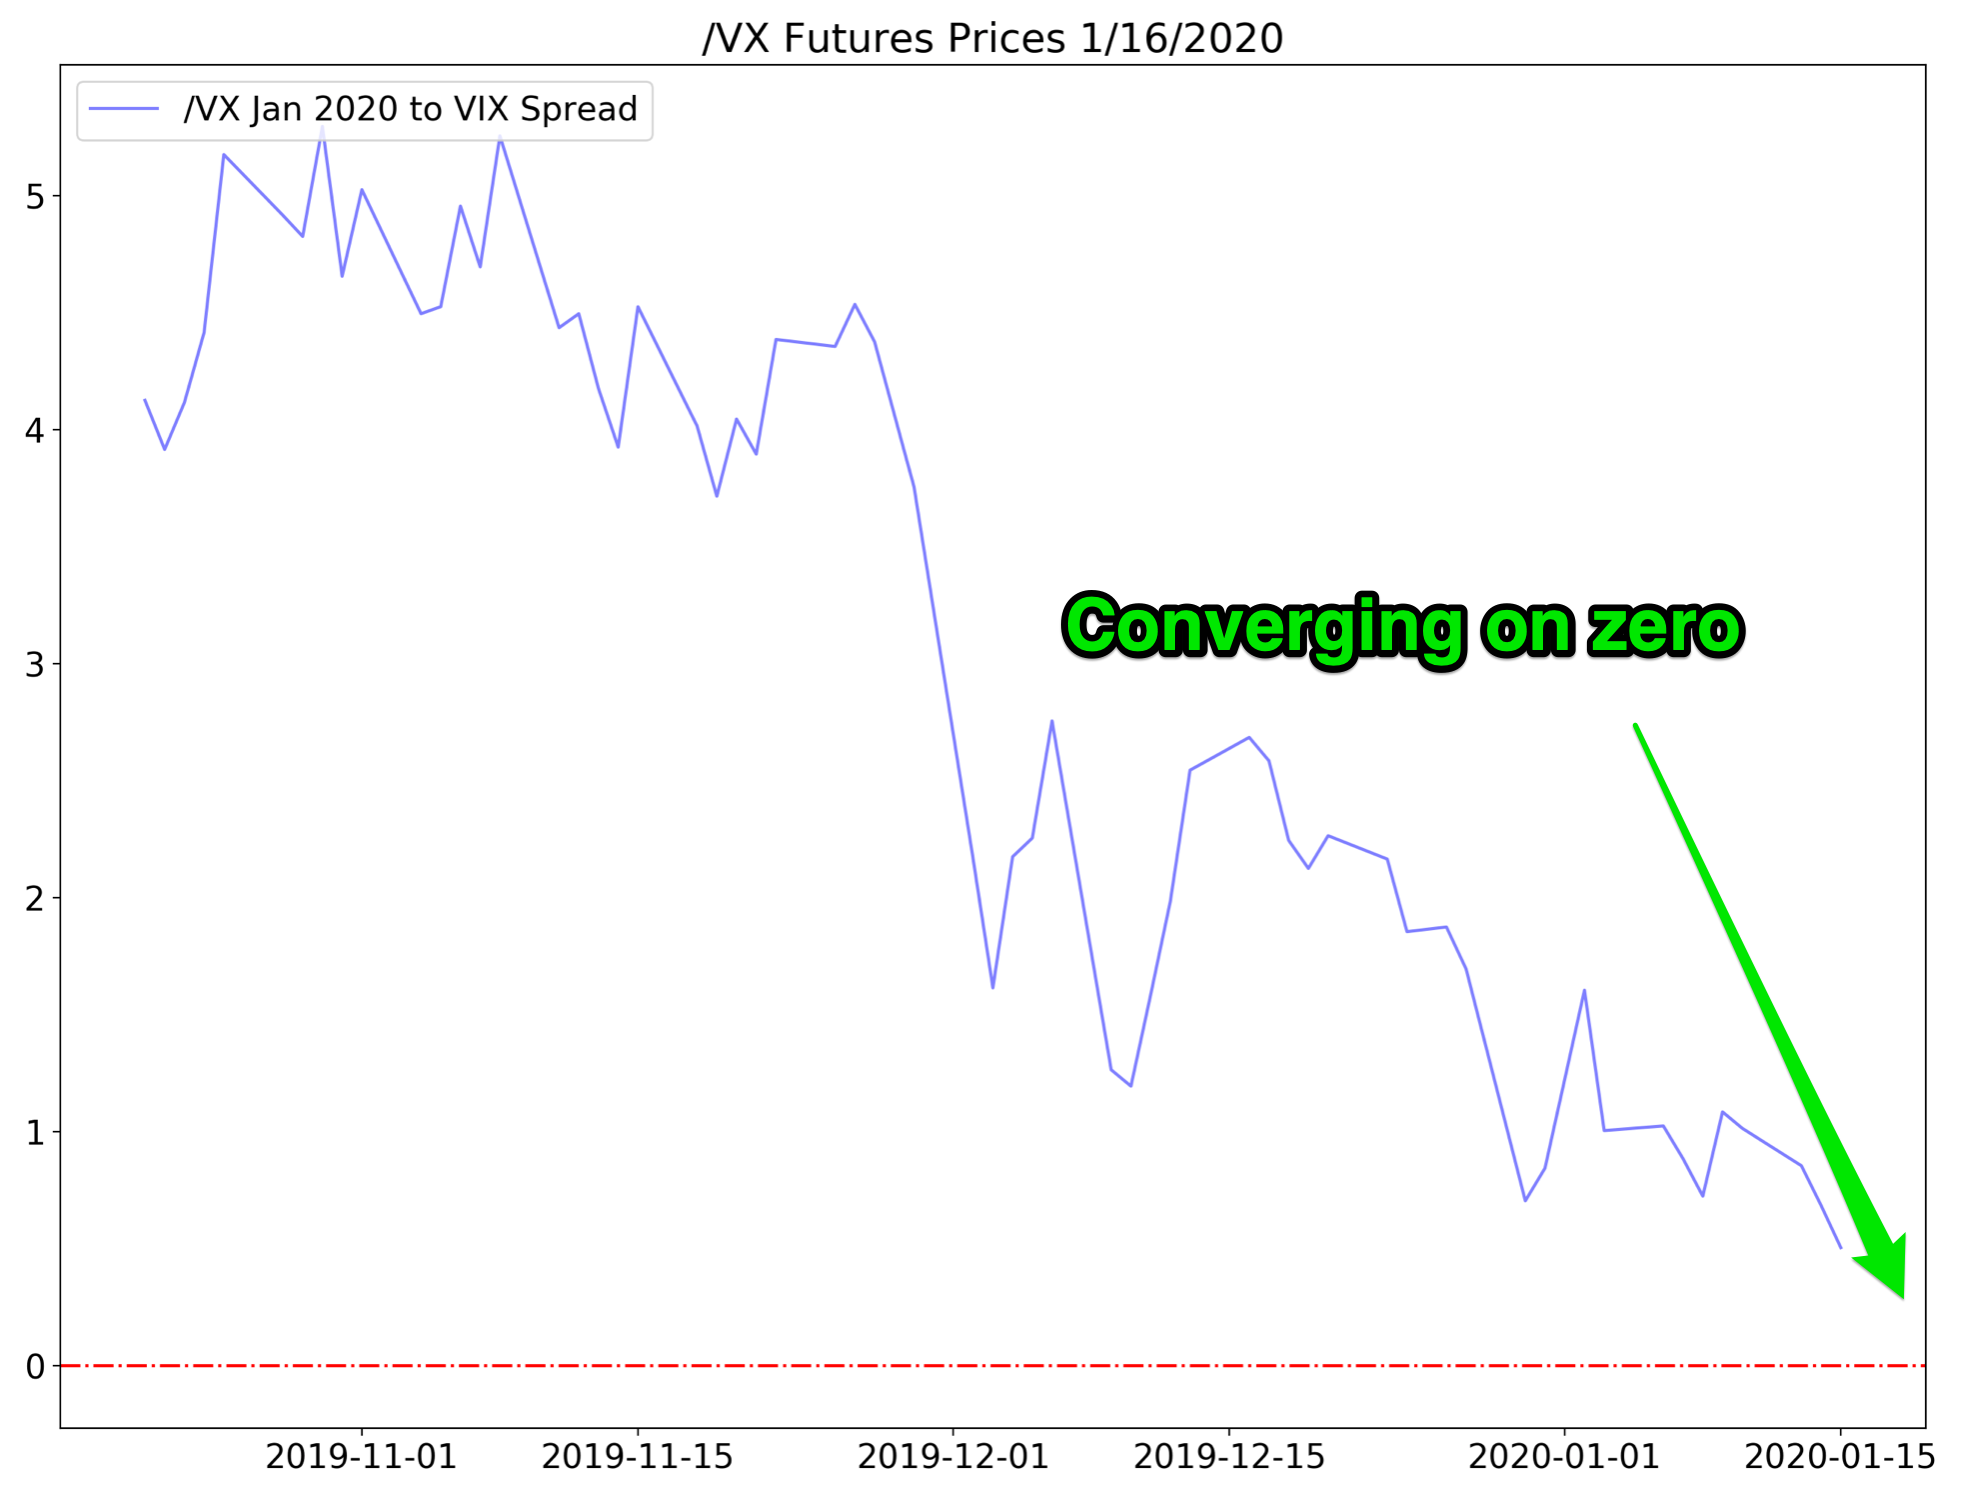
This gives a better view of how the difference between the futures price /VX and the spot price, VIX, are converging to the same value as we near expiration on 1/22/2020. Since there are fewer days to go, the interest in storage charges are very small for the one week remaining. As we get closer to expiration, the values will be almost identical until they converge to the same price at expiration.
It's very similar to how the time decay in options works as the expiration day approaches.
The same with just about any commodity, crude oil, gold and even /VX futures. Storage and interest on storing crude oil, bars of gold or silos of soy beans is easy to grasp. But where does the storage and interest come from on /VX futures!? We'll circle back to that, but it is almost the exact same thing.
Before we do that, we need to explore two more geeky terms unique to futures markets. Contango and backwardation. And once again it's easier to understand by looking at crude oil and out widget factory.
More cheap oil please
Back to our widget factory. A quick review at the factory.
On March 2nd, we bought 20 /CL contracts at $35 to take delivery of oil on March 31st. But what does the contract price look like for April, in case we want to lock in some more cheap oil for April too?
If we go out to April, the April /CL contract price might be $37. This is because the April /CL price has to account for the interest from the purchase date to delivery date - March 2nd to April 30th, or 58 days. When the futures price is higher than the spot price, this is known as contango. It's a geeky word and it just means the futures prices are higher than the spot prices.
However the opposite scenario can happen, which is the futures prices are lower than than the spot price.
Let's say we once again buy 20 /CL contracts for $35. But this time, the spot price is $40. The spot price is higher than taking delivery in 30 days - the 30 day out price is $5 less than the spot price. What happened to the storage and interest charges!?!?
This is where market speculation comes into play and gives us a lot of useful information about the futures market believes about the price of oil. What the /CL market is telling us is that it believes the price of oil at $40 is too high and that it's likely to fall below $35 before expiration. Fall well below $35 since we still need to pay for storage and interest charges. In the case when the spot price is higher than the futures price, it's called backwardation. It's the opposite of contango. Think of contango as upwardation - prices are going up in the future.
Fast Forward From 1850 to 2020
Let's take a look at two modern day futures markets, crude oil /CL and the VIX futures /VX.
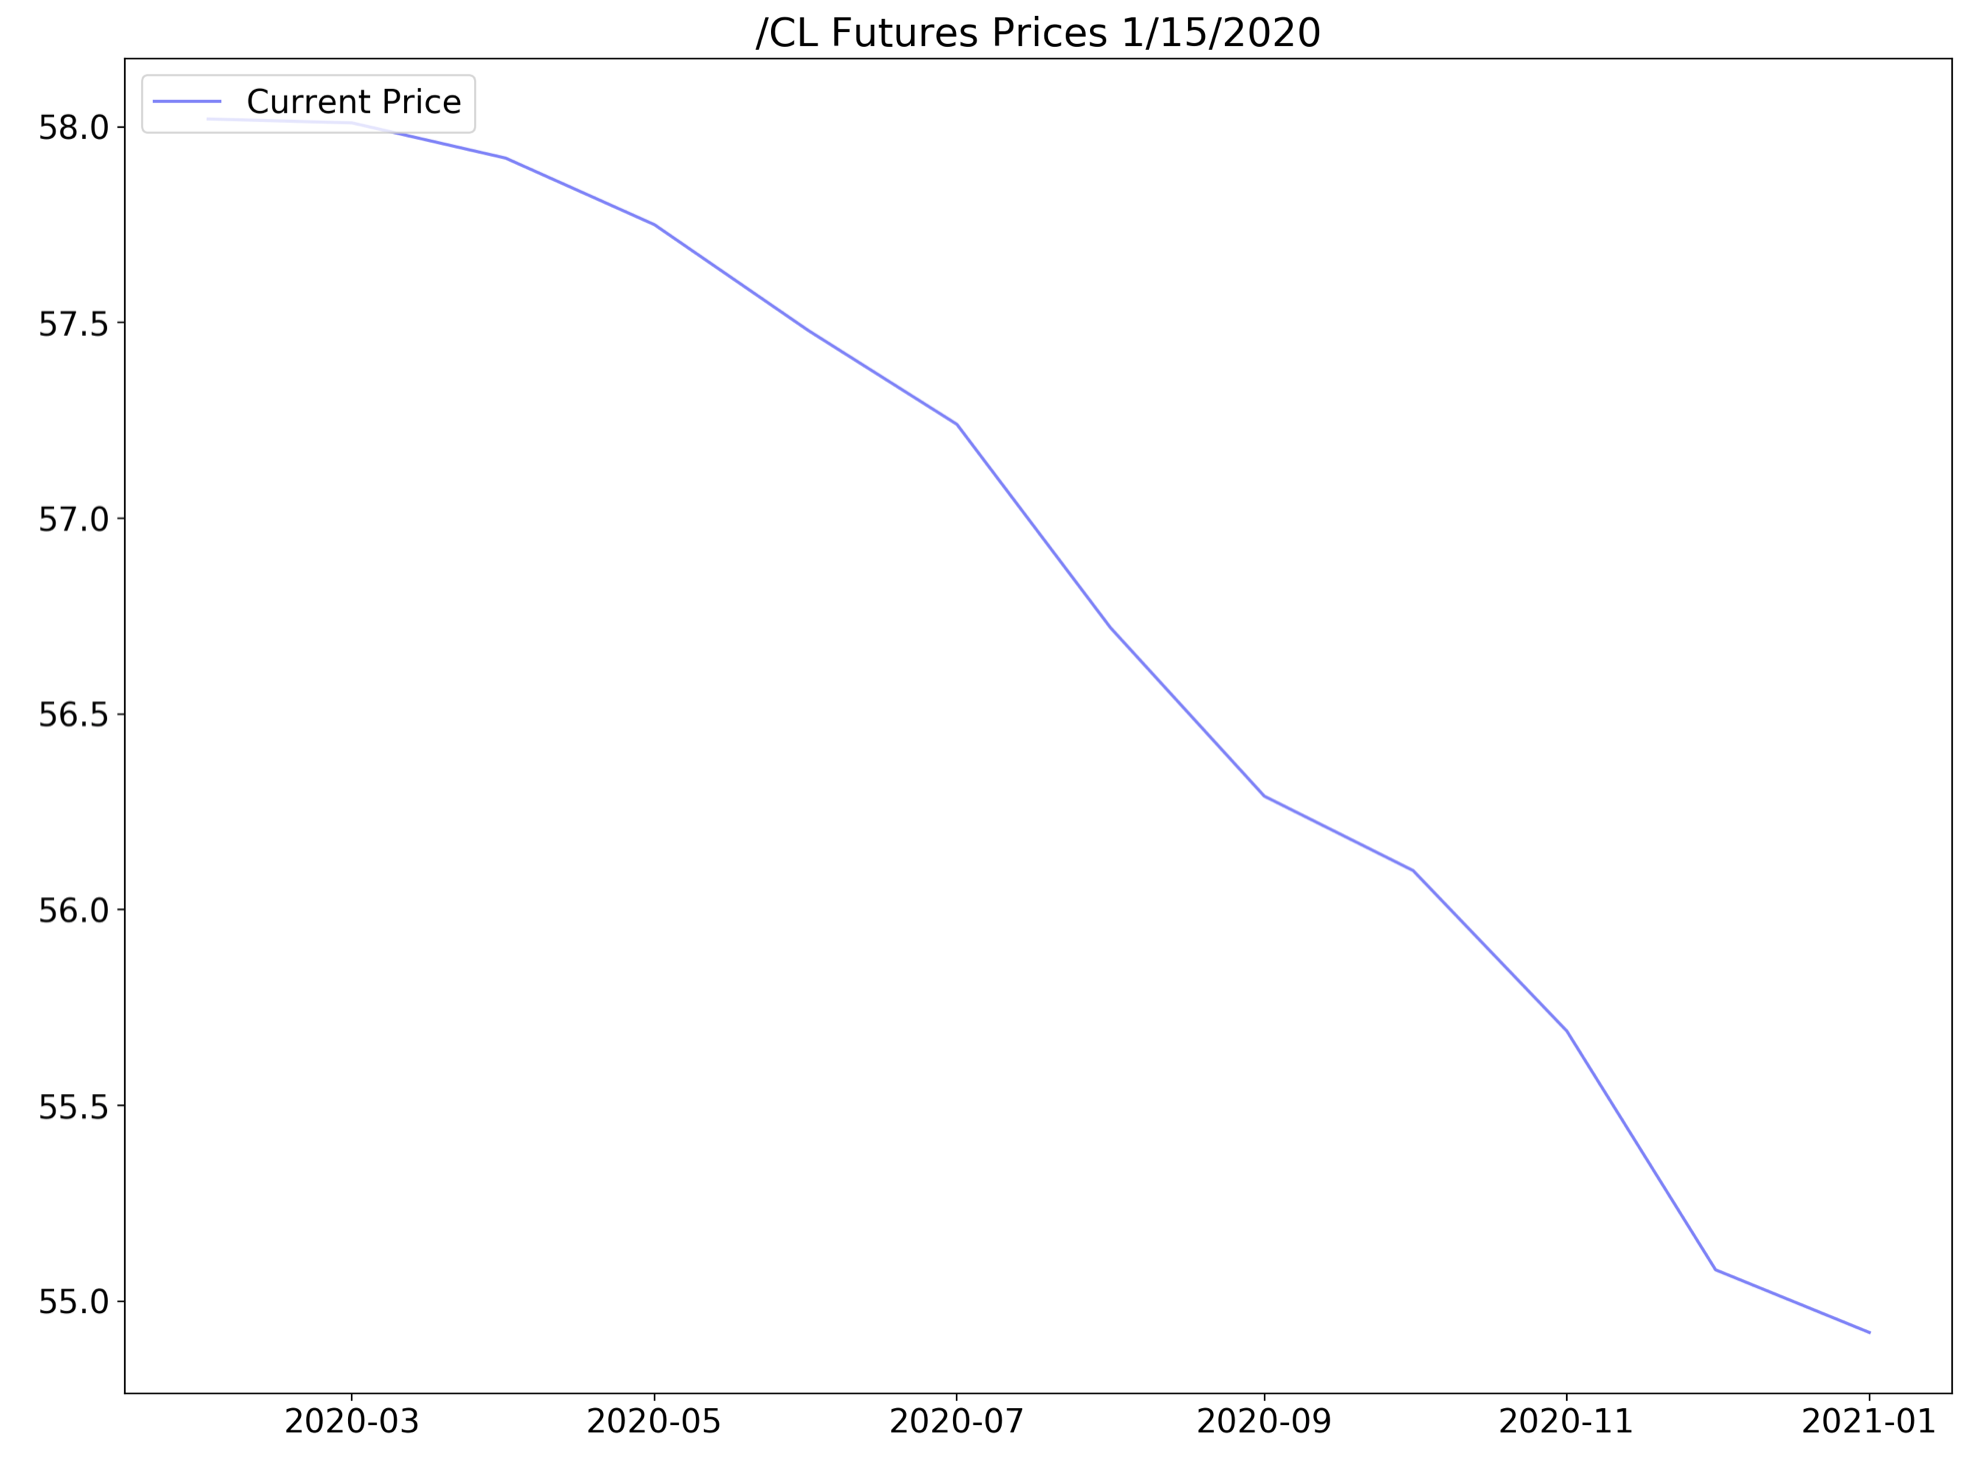
This is what the current state of the /CL futures prices look like as of 1/15/2020. As we go out one year to January of 2021, /CL futures are trading below $55/barrel. As of the market close 1/15/2020, the front month contract is trading at $58.02 Currently, the /CL market is in backwardation - prices in the future are lower than they are now.
Translation into English: the futures market is not exactly bullish on oil right now.
It's expecting the price of /CL to be lower in January 2021 than $54.92 than it is today of $58.01. This tells us that by the time you factor in storage and interest for almost a year until January 2021, the market is forecasting an oil price well below $54.92.
Anticipated price of crude oil in January 2021 = spot price + 1 year of interest and storage costs = $54.92
Now let's look at the current /VX futures.
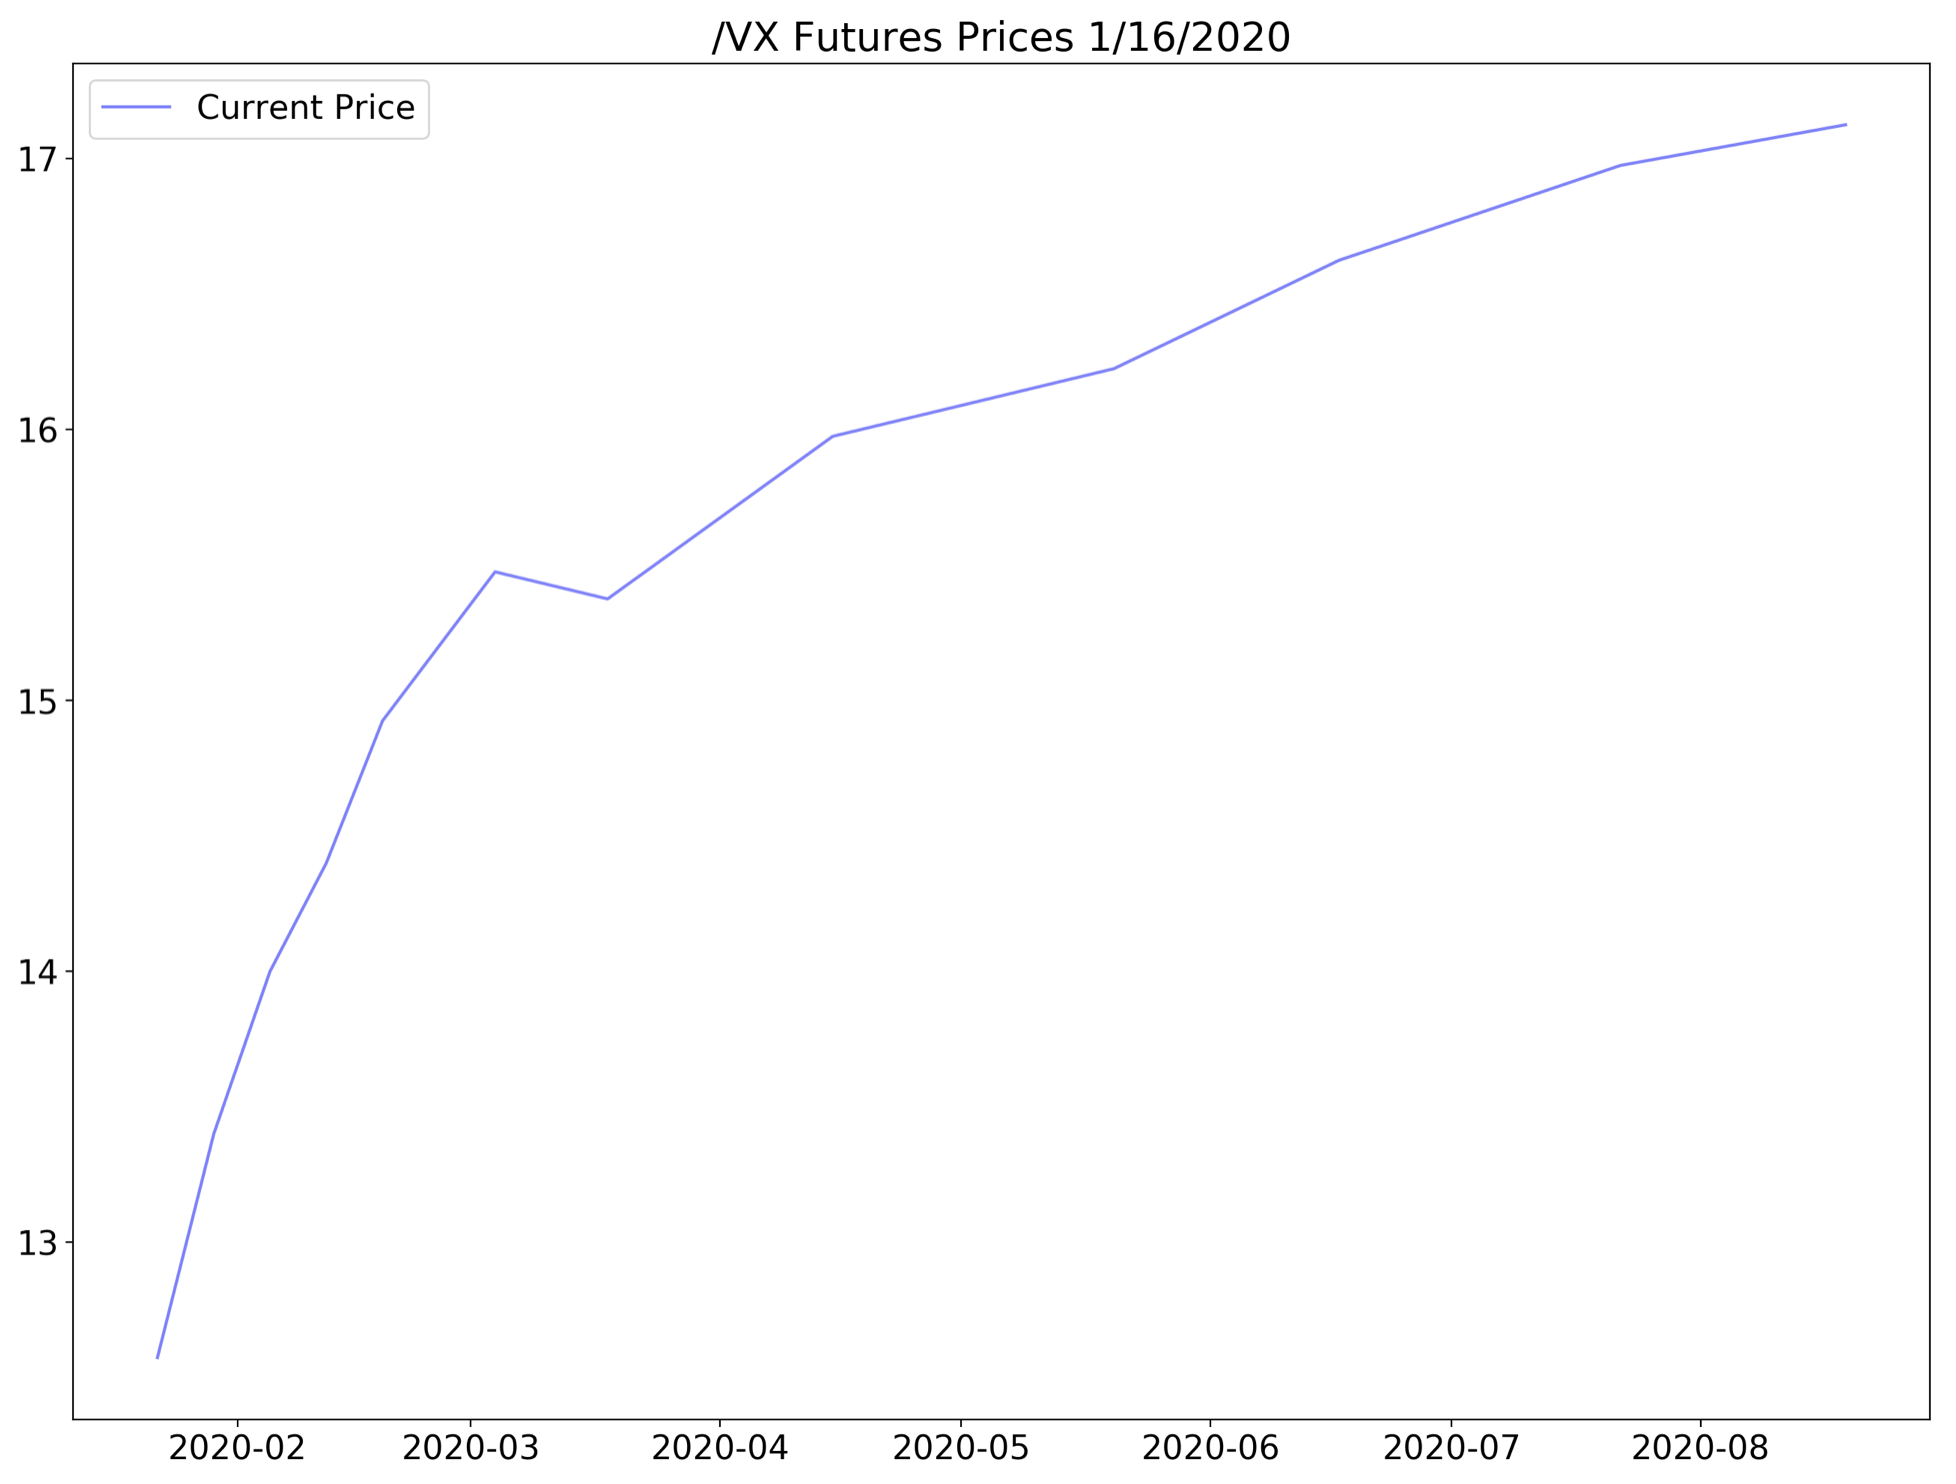
The front month (the one that expires the soonest) /VX futures is trading for around 12.5. And the back month (the last expiring contract) expires in August 2020 is trading for around 17. This is a glaring example of contango - the prices in the future are higher than they are now.
Futures markets are either in backwardation or contango. This gives us a lot of information about what the market believes about the current spot price and future prices of a commodity.
...And finally, the TS in IVTS!
After taking the long road through our widget factory, we're finally arriving at the TS in IVTS. The term structure is the geeky terminology for the ratio of the current futures price compared to the price in the future. In the case of the IVTS, it's the 3 month value from the current value. If that sounds confusing, let's go through an actual example.
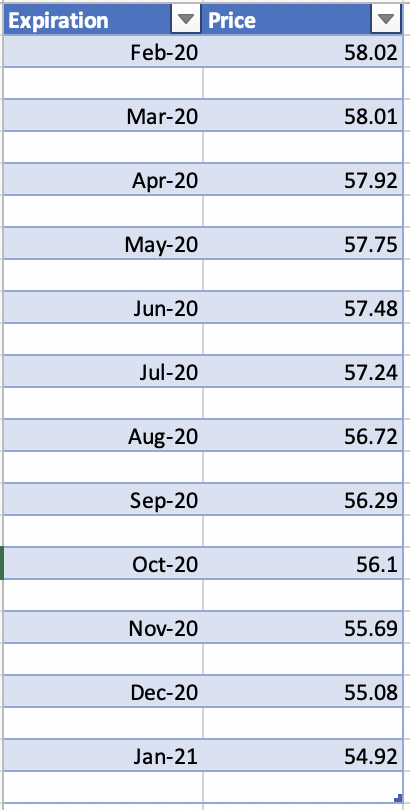
Since we're using crude oil, let's look at the current /CL futures value (also called the front month in futures geek speak). The front month is February 2020 with a price of $58.02 and the /CL value three months out would be the May 2020 value of $57.75.
If we want to look at the term structure, let's review the IVTS formula, now let's call it CLTS for crude oil:
CLTS = $58.02/$57.75 = 1.004
The current CLTS value is 1.004, which is slightly in contango.
Normal values for most markets range between .8 and 1.2. When the term structure values are below 1.0, markets are in contango - the futures prices are higher as we go out in time. For values above 1.0, futures prices are in backwardation, which means futures prices are falling as we go out in time.
Now let's circle back to the IVTS and plug in the current VIX and VIX3M values:
VIX = 12.56 VIX3M = 14.95 IVTS = 12.56 / 14.95 = .84
IVTS = .84
A value of .84 tells us the market is deeply in contango. When the IVTS is deep into contango territory, it tells us we are in a quiet (quiet = low volatility) bull market. The market is quietly grinding higher and that is indeed the case at the moment.
You might have noticed a slight twist here in the difference between the way we calculated the crude oil term structure and the way we calculated the VIX term structure. In the crude oil version, we used the /CL futures prices. In the IVTS, we didn't use the /VX futures, we used the actual VIX and VIX3M index values. Why?
Because it makes things easier and tells us essentially the same thing. The VIX and VIX3M are readily available from many sources, including Yahoo Finance (symbols ^VIX for VIX and ^VXV for VIX3M) . With the IVTS, the contracts we need to use would constantly change every month. Each /VX futures contract has a different symbol, as we can see from table below.
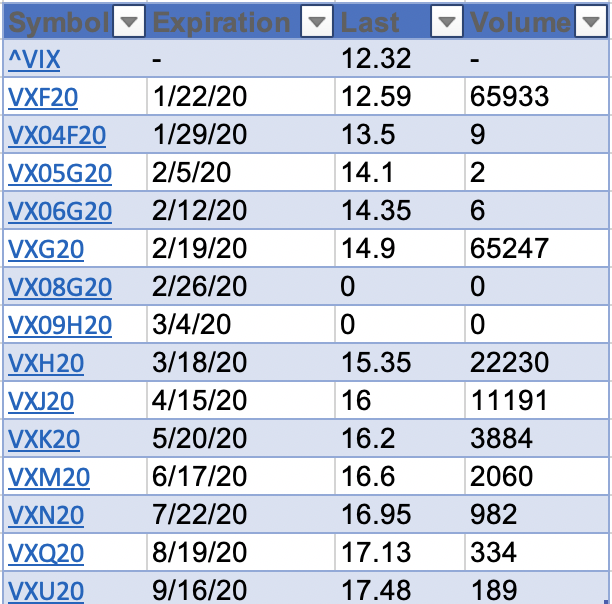
Each /VX future contract has a different symbol based on the expiration. The contract that expires 1/22/20 is VXF20, VX05G20 for the 2/5/20 expiration and VXU20 for the contract that expires 9/16/2020. Constantly changing the symbols used in the calculation would be a PIA, without any additional benefit.
So VIX and VIX3M it is.
So after all that, what does the IVTS actually tell us!?
The good news is the leg work you put in to understanding the IVTS was so worth it.
In it's simplest form, it tells us if the /VX futures market is in contango or backwardation.
+ Values of the IVTS higher than 1.0 tell us that the market is in backwardation.
- Values below 1.0 tell us the /VX futures are in contango or upwardation.
The /VX futures are in contango more than 80% of the time. Let's look at a current IVTS chart and how this benefits our trading.
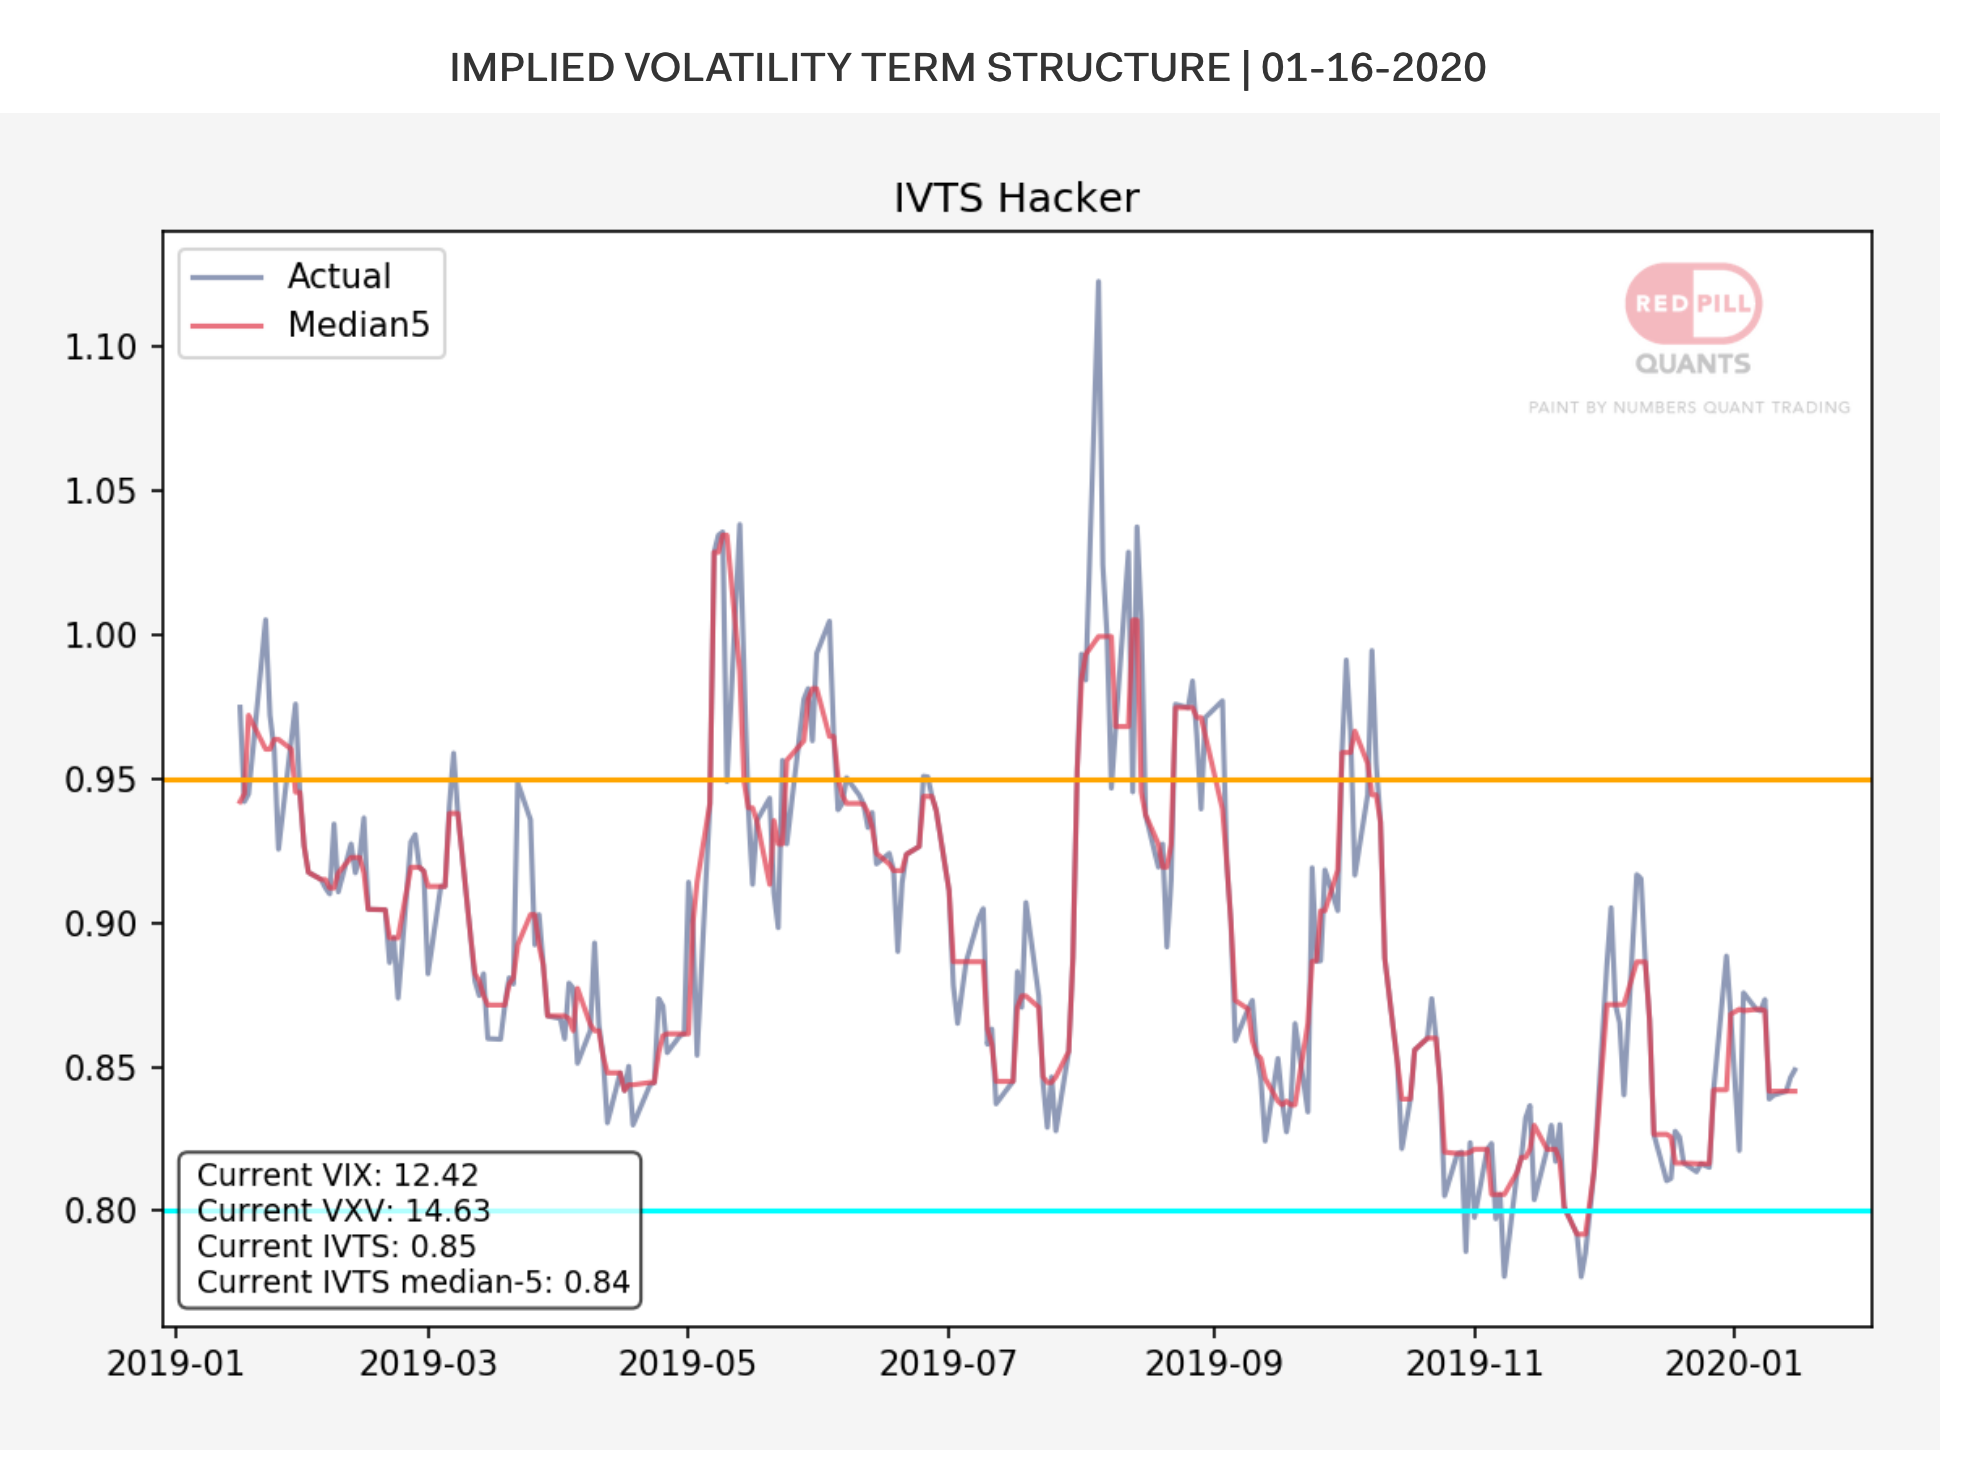
The current value of the IVTS as of the close 01-16-2020 is .84. That means the VIX is deep into contango territory. A value of .84 tells us the overall market conditions are a low volatility bull market. Based on this, there are certain types of trades that we need to be taking. And the reason is that, based on the IVTS, they have a much higher probability of success. Or in English, these trades have a substantial statistical edge when the IVTS is in deep contango. The three trades we will be looking at:
1. Long exposure to SPY
2. Trades that benefit from SPY staying with the expected weekly move. The weekly expected move is easily figured from the SPY options.
3. Extracting roll yield from /VX futures (that sounds super geeky, but it's super simple once I translate it into English).
Let's start with number 3 - extracting roll yield from /VX futures. I'm not going to break it down in detail here, rather just scratch the surface of what this is.
Going back to our widget factory, remember the storage and interest charges that are baked into the futures /CL price of oil? Well, imagine if the interest was 7% per month and we could extract that out of the /CL futures with a simple trade? But instead of /CL, we're going to do it with /VX futures.
This is exactly what many hedge funds do.
Because if done properly, this can return up to 75% per year (some funds are over 100%). That is not a typo. And this is the reason why there are 100s of papers written on the IVTS by PhDs and quant researchers.
The IVTS is what many quant funds use to get in-and-out of this trade and long market exposure in general. However be warned: if you don't know what you're doing, the short volatility trade is very risky and it will lay waste to your trading account. We go deep into the nuts and bolts of how to do this properly in the IVTS Trading Strategies section.
I'm not going to cover the specifics of how to do it here, rather just know it's a very popular trade in the professional trading world. The reasons are obvious.
Because of the extensive research into the IVTS, by really smart people, we're able to ride their coat tails and use that to our advantage. And that simple advantage is this: the IVTS is one of the few metrics that have any correlation to what's likely to happen in the future in the market. Because it's based on future prices.
Trading indicators tell us about what happened in the past. The IVTS tells us what is likely to happen in the future because it's essentially based on future prices.
If you think this is complicated, I'll break it down into the simplest terms: when the IVTS is over .95, get out of all long positions and any short volatility positions.
That's the basics of it. If you taken a simple SPY buy-and-hold and simply move to cash when the IVTS is over .95, and then back in to SPY when it falls back below .95, it essentially doubles the return of SPY over many, many years. Not to mention compounding. Lots of funds do this too and typically outperform SPY by a wide margin.
The nuts-and-bolts of trading are slightly more complicated, but still paint-by-numbers simple. We cover all of these in the IVTS Trading Strategies section of the course.
Finally, to wrap up, here is again a chart we started with. Take a look now and watch what happens with the IVTS crosses over .95 - the red horizontal line on the chart below. More times than not, it will get you out of the market before some bad shit be goin' down.
From the chart, it's hard to tell exactly how well getting out at .95 works. In the strategy section, we'll look at exactly how effective this is and what type of returns it generates.
