
What Are The E-Mini S&P Futures?
The E-Mini futures were originally launched in September 1997 to attract non-professional investors into trading index futures. Previously, the only game in town had been the “large” SP contract – but it had become too expensive for the ‘little guy’ to trade. So the CME created the E-Mini contract which was 1/5th the size of the “large” S&P 500 futures contract and required 1/5th the margin to trade.
Over the past decade the E-mini has become a huge success. Not only with retail but with institutional traders too. Now everyone trades the E-Mini: mutual funds, pension funds, hedge funds, insurance companies, high frequency trading (HFT) firms, trading syndicates and individual/non-professional traders. And we here at Red Pill Quants are no exception as the E-Mini has always been a mainstay of my trading activities.
Right around the launch of my first trading blog (Evil Speculator) in 2008 I was researching various ways of better measuring participation and trading momentum in the E-Mini. In the process I developed a market oscillator I ended up calling the Zero.
What Is The Zero Indicator?
The Zero is a simple to use but at the same time sophisticated and accurate market trend and momentum indicator. Its purpose is to alert us when an trend reversal in the underlying is about to unfold. Thus it should not be considered a lagging indicator – actually quite to the contrary. The optimum time frame for this indicator appears to be an hourly chart, therefore it is thought to be best used for medium term trading (i.e. trades lasting several days to maybe a little over a week).
Intra-day the Zero Lite on the right side of the chart is where all of the action is. Short term traders have come to appreciate the appearance of price/signal divergences which often are precursors of developing short term trend changes. Seasoned traders may also find value in the Zero by correlating their own analysis with the indicator running against a major average such as the S&P 500, Dow Jones, or NASDAQ.
If you have any questions or suggestions then feel free to drop me a line.
How To Use The Zero
The idea behind the Primary Zero indicator (PZI) is to get positioned at the very cusp of trend reversals. The average period of a trade is measured in days, thus no haste should be taken when initiating trades. The Zero Lite on the right side of the live chart should be mainly used for intra-day swing trading.
How Can I Get The Zero Indicator?
The Zero is a free complement to our existing offerings. If you are interested in becoming a Foundation or Unlimited member please contact us here or shoot us a message at clientservices@redpillquants.com.
See The Zero In Action
You can read the tutorial below but quite frankly the best way to realize the potential and advantages the Zero indicator offers is to watch some of the wrap up videos I have produced in the past few years. Not only are they entertaining but they also highlight key observations such as divergences, reversal signals, waning participation, trend day tape, etc.
Shown below are some of the highlights of videos we recorded a few years back. The indicator has not changed since then as its implementation and concept has proven to be valid.
The Mole Oscillator
Sandwiched between the price chart and the Zero Indicator you find the Mole Oscillator, which is an additional rendition of the Zero. Its purpose is to render the level of participation in the form of an activity bubble in which the lower red signal represents selling pressure and the upper green signal represents buying pressure. The white dotted line in the center indicates the current direction of the buy/sell participation ratio.
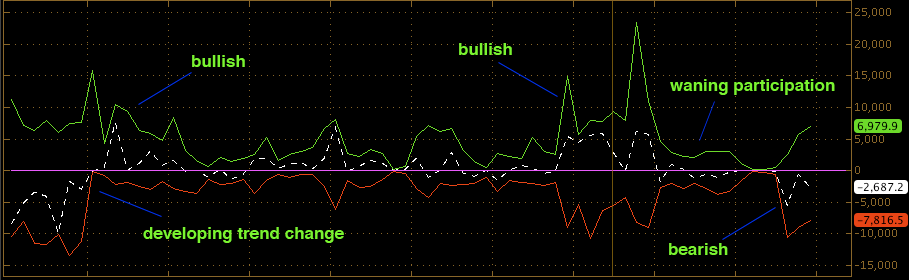
The Mole should be seen as a different way of visualizing the Zero – as a matter of fact it represents an early version of the Zero Indicator. It has been added to the Zero chart since it often offers valuable clues as to impending swings in momentum or shifts in participation.
For example – be on alert when you see the Mole’s ‘bubble’ expand or contract – the former indicating strengthening and the latter a weakening of the current trend.
Bullish Mole Signals:
- Bubble Expands on both sides but green line dominates the red line.
- Dotted white line above the zero mark and pointing up.
- Dotted white line near or touching the green line.
- Red line near zero mark while green line pushes to the upside.
Bearish Mole Signals:
- Bubble Expands on both sides but red line dominates the green line.
- Dotted white line below the zero mark and pointing down.
- Dotted white line near or touching the red line.
- Green line near zero mark while red line pushes to the downside.
Weakening Trend Signals:
- White line below the zero mark and pointing up.
- White line above the zero mark and pointing down.
- Red line pointing up.
- Green line pointing down.
Purpose of triple chart layout
The screen grab on the top of this page is separated into three panels:
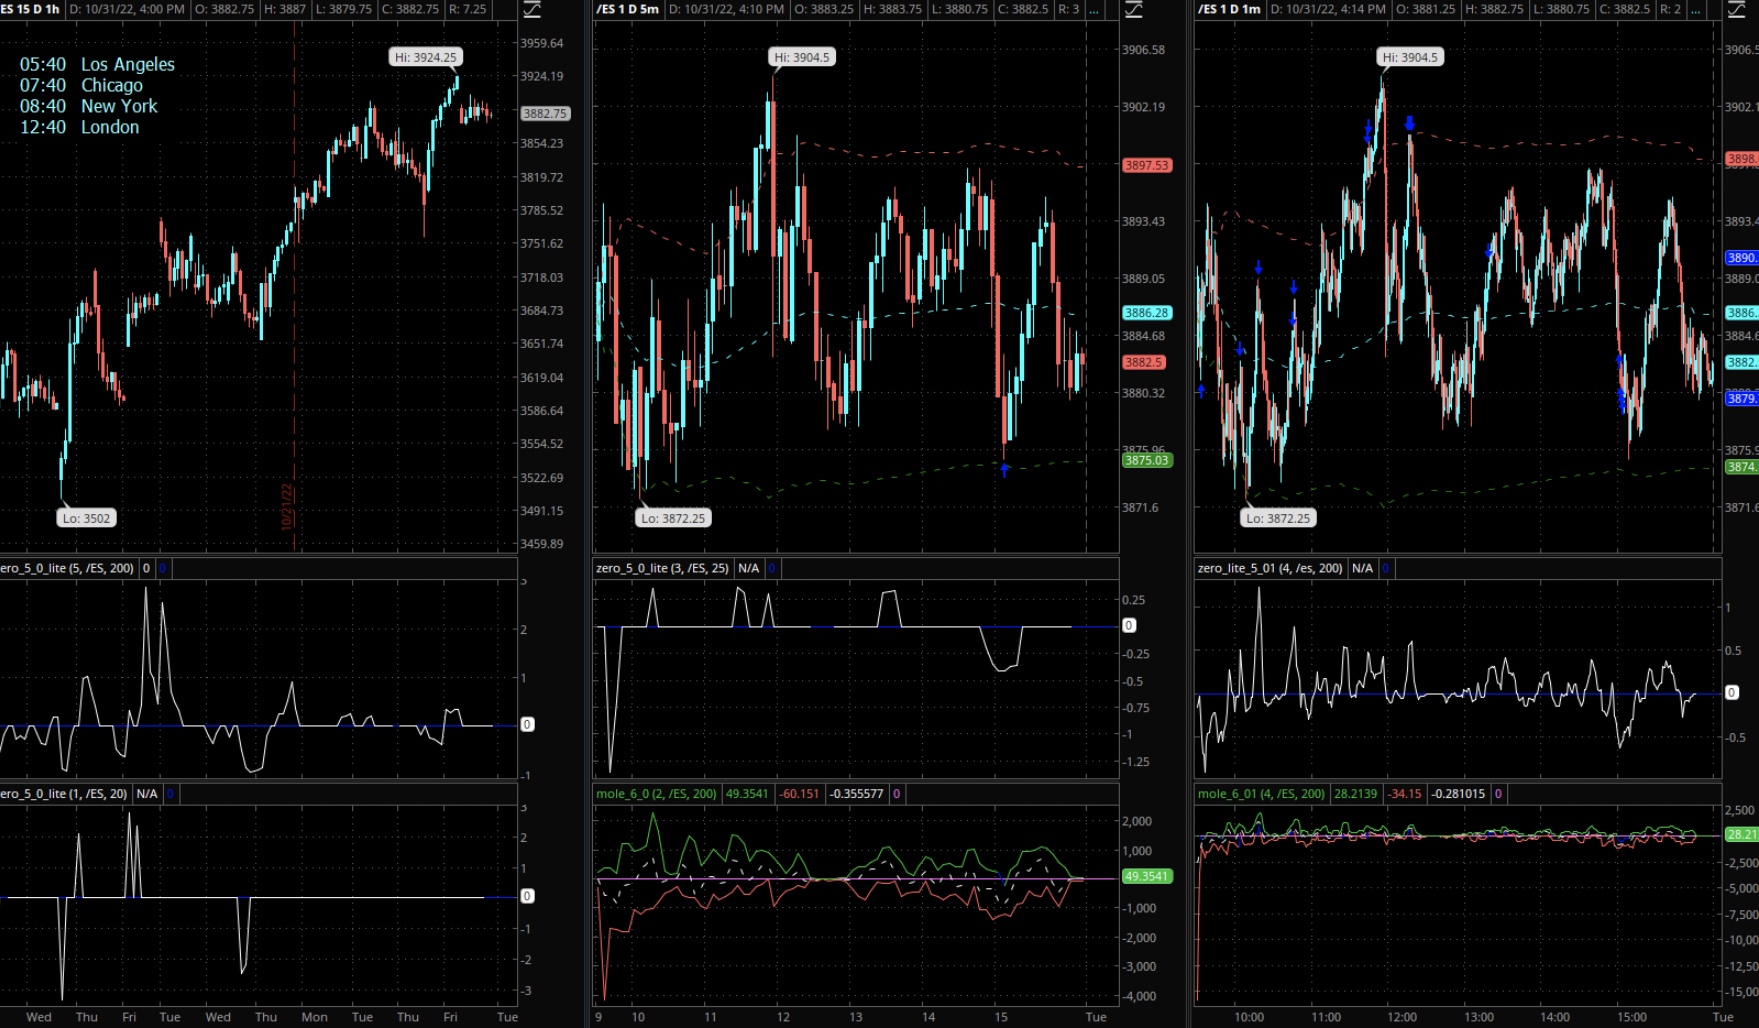
On the left side you see our primary zero indicator which spans 5 days on a 1-hour chart. In the middle you find the Zero Lite indicator, which spans 2 days on a 5-min chart. And finally on the very right you see the Zero Micro indicator which spans one session on a 1-min chart.
Under volatile conditions the ZLI can be useful as an early warning system for sudden slingshot rallies or sudden drops. It can also serve as a great tool for swing traders as it appears to be effective in identifying turning points in price action via divergences.
In a volatile market environment high velocity directional price changes are often caused by program trading and HFT (high frequency trading) as a large volumes of orders suddenly hit the market in a very small amount of time.
This may be caused by an important price level being breached, a long term moving average being crossed, or perhaps by external news causing traders to either enter into or exit out of a large number of contracts.
The Zero indicator can be extremely helpful in recognizing such slingshot moves so that early exits/entries may be taken.
Zero Lite Divergences
A key phenomenon to look out for on the Zero Light Indicator (ZLI) are divergences between the signal line and ES price movements. Since the introduction of the ZLI such occurrences have often proven to be great setups to take advantage of impending intra-day price swings. The best way to explain ZLI divergences is to look at an example:
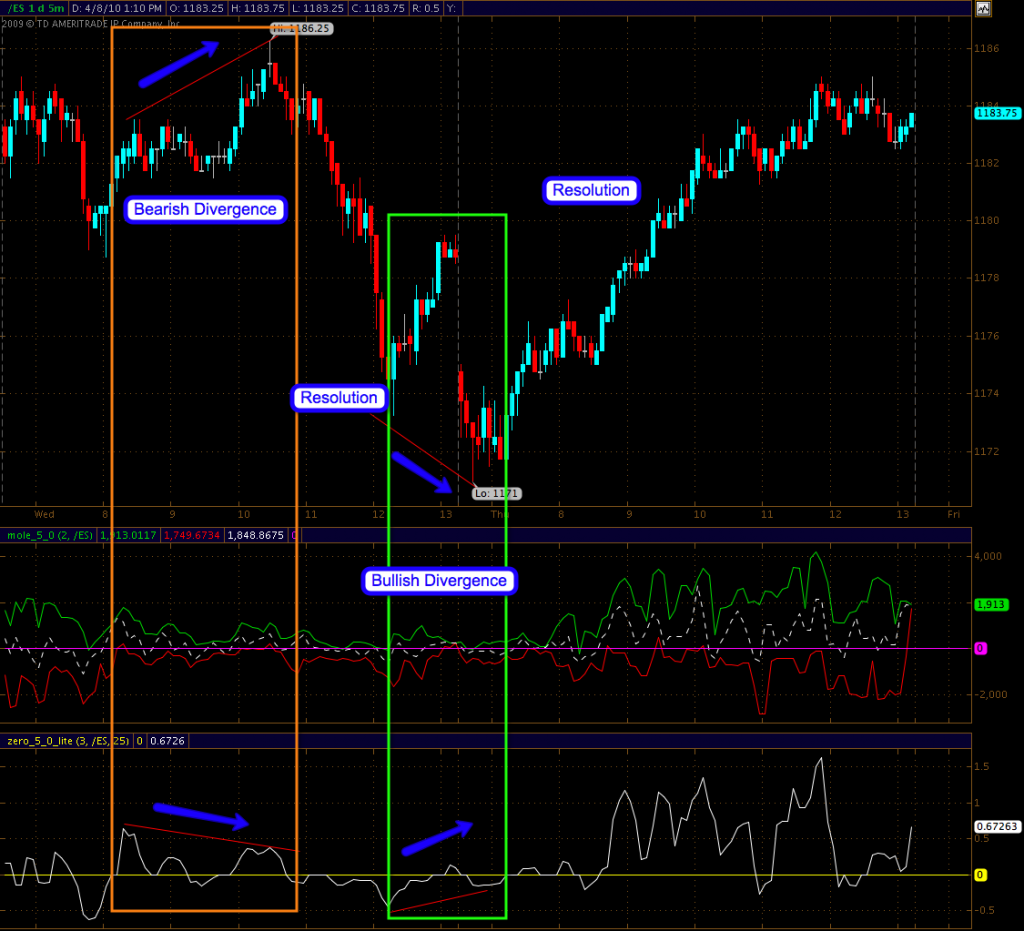
Shown on this chart are two textbook occurances of signal/price divergences on the ZLI. The first one framed in orange represents a bearish divergence. We call it a divergence because the strength of the positive signal appears to be diminishing while the ES futures happily continue to climb higher.
If we draw a line from the respective peaks on the ZLI on the bottom and the ES price chart on the top we find that the peaks on the ZLI are trending down – at the same time the ES price peaks are trending up. In technical analysis this is called a price/signal divergence and as you can see on the chart, taking a contrarian position (i.e. going short the ES futures) proved to be quite profitable. The inverse example of a textbook bullish divergence occurred the very next day.
Again we see a divergence between the ZLI and the ES futures – just that in this case price is trending downward while the ZLI’s signal line is trending upward.
Bear in mind that taking a contrarian position when divergences occur is not a guarantee for success. However in the twelve months since the introduction of the ZLI these type of divergences appear to resolve as expected a majority of the time.
Frequently Asked Questions & Issues:
Why does does the tip of the Zero move?
The zero is a technical chart indicator just like the MACD, the RSI, or a stochastic. Therefore it behaves very similarly, in that that the tip of the line changes along with the underlying symbol until the current interval of the chart is over. That means on a 1-hour chart the tip of the zero might keep moving until that hour is over. At that time, and only then, will the final position of the signal line become permanent.
The live image on the page seems stuck!
First, try to force a complete reload of the page:
- Chrome/Brave/Firefox: Press the SHIFT key while clicking on the reload button.
- Internet Explorer/Safari: Press the CTRL key while clicking on the reload button.
If the new image still seems out of sync by more than a minute or two (the system time is on the top left in the black square), then please alert us by sending us an email to clientservices@redpillquants.com.
Can you make changes to the colors or layout of the Zero chart?
Sorry, but after 14 years of hosting the Zero indicator we have arrived at a layout and color scheme that is enjoyed by the vast majority of our subscribers.